13 results
7th grade graphing thematic unit plan pdfs
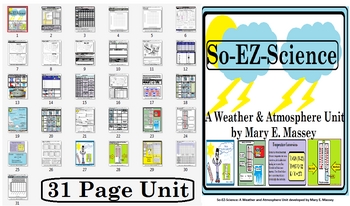
So-EZ-Science: Weather & Atmosphere Unit
This unit is a balanced literacy unit covering areas such as: temperature conversion, making a rain guage, recording weather, using weather station symbols, using the Beaufort Wind Scale, fronts, cloud types, cloud cover, graphing precipitation, graphing temperature, graphing weather phenomenon, weather tools, relative humidity, calculating relative humidity, precipitation, interpreting weather symbols on a weather map, reading a weather map, wind velocity, wind direction, wind speed, reading a
Subjects:
Grades:
3rd - 12th, Higher Education, Adult Education, Staff

"Playing the Stock Market" Cooperative Unit, Economics & Spreadsheet Skills
So they can make fiscally sound decisions as adults, students need to be taught about how money and stocks affect the economy. But it's complicated to understand and can be hard to teach.
This unique unit takes it step-by-step, scaffolding the information so that students have a comprehensive understanding of how money is made and lost in the stock market. The series of lessons teach students about investing in the stock market starting with an investigation into the various ways money can be
Grades:
6th - 9th

Characteristics of Fairytales Unit
I've designed this unit to be used with differentiated instruction. Some worksheets could be used at a center. This thematic unit contains a card game similar to Old Maid (cards included for you to print multiple copies of) to reinforce the many characteristics of fairytales. During the card game students are using math skills by making a tally chart and bar graph. There are worksheets for coloring appropriate clip art that represents each characteristic, labeling, matching, word search, Venn
Subjects:
Grades:
3rd - 8th
Interdisciplinary Project Math Emphasis
This interdisciplinary project has a strong math component. It is often difficult to create a project-based unit that utilizes math in a meaningful way at the upper elementary and middle school levels. This project was designed to allow students to make use of a variety of math skills while including aspects from different disciplines. It can be completed entirely within the math classroom, or undertaken as a joint effort among different disciplines.
Included are teacher notes that show the i
Subjects:
Grades:
5th - 7th
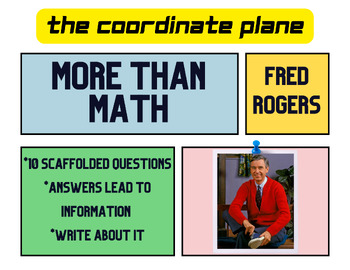
More Than Math: Fred Rogers (The Coordinate Plane)
Math Questions + Biography + Writing Opportunity = WIN!10 Scaffolded Questions on The Coordinate PlaneEach question answered leads to information about Fred Rogers!Students can then use their answers to write a short bio about Mr. Rogers!History, Math, and Writing; All in One!Answer Key Included!
Grades:
5th - 8th
Graphs - Differentiated Blooms Enrichment Unit
Ready-to-use units that include differentiated activities keyed to Bloom's Taxonomy, each with an accompanying product and self-assessment rubric. All students can complete an activity in each level. The differentiation is in the levels of the product rubric.
The unit packet includes teacher information, identified standards, explanations of the 6 Bloom's levels, assessment rubric, print and internet resource tracking sheets, Product Criteria Cards, and 6 student activity cards correlated to th
Grades:
3rd - 8th
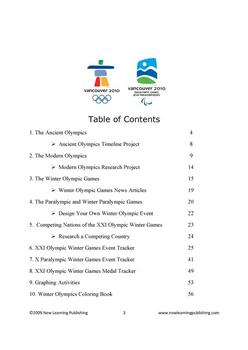
Vancouver 2010 Winter Olympics
Get your student involved with the 2010 Vancouver Winter Olympic games with a great all in one unit study! This unit study is designed to teach students about the past and present Olympic Games as well as the Paralympic Games. Students will read about the significant historical events of the Games and complete activities including research, creating time lines, and writing a newspaper column. Students are also provided with a medal tracking sheet to keep track of the 2010 events. Graphing activi
Subjects:
Grades:
3rd - 8th
Fidget Math Frenzy- 5 Performance Tasks
If your students are anything like mine, they are going crazy over the new fidget craze! As teachers, we have to challenge ourselves to embrace the crazes and turn it into a teaching point that can engage the kids in their learning. I created this product for my own classroom because I knew it was something my kids would dive into!
This product consists of 5 different performance tasks centered on the fidget which include:
-collecting data on spin time and finding the mean, median, mode and
Subjects:
Grades:
5th - 7th
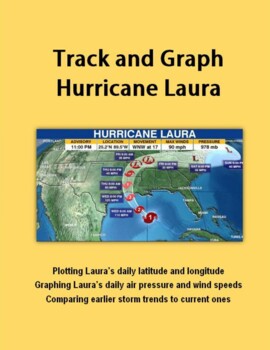
Track and Graph Hurricane Laura
Track and Graph Hurricane Laura includes a map of the Atlantic Hurricane Basin with latitude and longitude plot lines shown (geography); latitude and longitude points to plot on the map (geography and math); a discussion of GMT and how it relates to CST; directions on how to create two graphs, one on Laura’s wind speeds and one on Laura’s barometric pressure (math, science); discussion of facts about Laura (science, math, higher level thinking); and a table of the most severe hurricanes to hit t
Subjects:
Grades:
6th - 8th
COORDINATES PROJECT: GEOMETRY: GRADES 4-7
This project covers research on the history of Descartes, latitude, longitude, and some graphing practice! There is a famous quote by Descartes on the front page.
Thanks for visiting the House of the Three Dinosaurs.
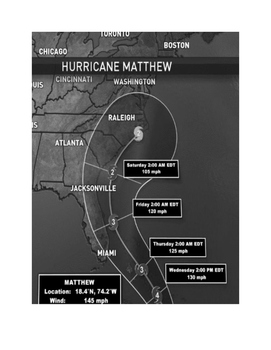
Hurricane Matthew: Interpreting latitude, longitude, wind speed, air pressure
By K. Powers, M.S.Ed.
Hurricane Matthew: Interpreting raw data:
Students will use a provided map and data to plot latitude, longitude and storm category.
Students will use provided data to create a bar graph (template provided) of highest daily wind speed.
Students will use provided data to create a bar graph (template provided) of lowest daily air pressure.
Students will interpret data on casualties (provided).
Questions and answers are provided for the teacher to help students interpre
Subjects:
Grades:
6th - 9th

Weather Lesson Plan
This unit is about weather. There are pictures of different weather (just the picture and with the written name), coloring pages, matching, pages for following directions and basic concepts, graphing the weather over a week, answering questions about their graph and making their own puzzle.
Subjects:
Grades:
PreK - 8th
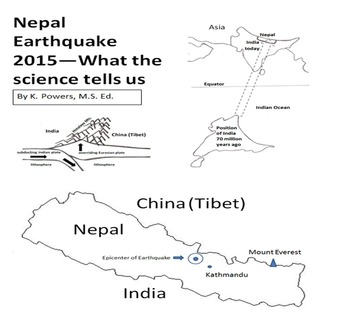
Nepal Earthquake 2015--What the science tells us
By K. Powers, M.S. Ed.
Several activities help students understand the science involved in the April 25, 2015, Nepal Earthquake. Those activities include:
• Using a map to show the movement of India over millions of years to understand plate tectonics. Q & A provided.
• Using a map to show the earthquake’s epicenter in order to locate the aftershocks and to understand what parts of Nepal suffered most. Q & A provided.
• Using data on the first 30 hours of aftershocks to create a bar
Subjects:
Grades:
5th - 8th
Showing 1-13 of 13 results


