TPT
Total:
$0.00

Middle School Science Graphs Worksheets Print and Digital Bundle

Rated 4.76 out of 5, based on 37 reviews
4.8 (37 ratings)
;
Classroom 214
1.1k Followers
Grade Levels
4th - 8th, Homeschool
Resource Type
Standards
Formats Included
  • Zip
  • Google Apps™
$16.50
List Price:
$24.00
You Save:
$7.50
Bundle
$16.50
List Price:
$24.00
You Save:
$7.50
Bundle
Share this resource
Report this resource to TPT
Classroom 214
1.1k Followers
Includes Google Apps™
This bundle contains one or more resources with Google apps (e.g. docs, slides, etc.).

What educators are saying

I have been using these as a review for our upcoming science testing. The students starting working in groups, then pairs, and now independently. Thank you for the great resource.
I used this as part of my graphing bootcamp at the beginning of the semester. My students really liked it.

Products in this Bundle (2)

    Bonus

    Digital Data Analysis Bonus File Print and Digital Bundle

    Description

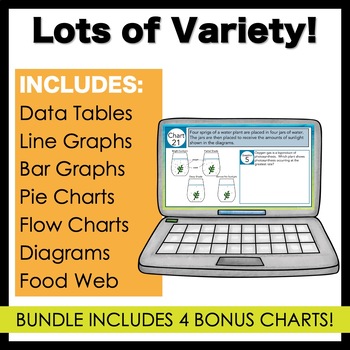
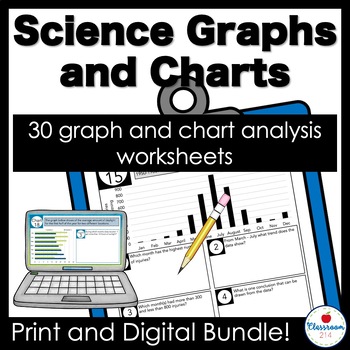
    Reading graphs is challenging! Teach your students to master comprehending and analyzing charts, graphs, and diagrams in just a few minutes a day! This mega pack gives students a graph or chart and five questions to help them comprehend and analyze it. Use with Google™ Slides or print them out.

    If your students are like mine, they collected data well during a scientific investigation, but struggle to understand and interpret what the data means. I solved this problem by creating this digital No Prep! Print and Go! pack of 30 different data sets plus four bonus graphs only available in the bundle. Each data set includes five comprehension and analysis questions to help students practice this important skill. Each colorful slide includes a brief introduction to the data, a copy of the data and a large space to answer the question. There is one question per slide.

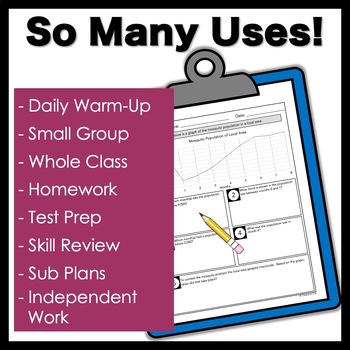
    Use them as a warm-up, bell ringer, in class assignment, or as homework! Answering just one question a day will take just the smallest bit of class time, but will keep their data analysis skills sharp! And, this pack will last almost a full year that way! 34 data sets x 5 questions = 170 days of day analysis! The bundle contains 4 exclusive data sets that are only available when you get the bundle.

    WHAT'S INCLUDED

    • 30 print and digital graphs, charts, data tables, and diagrams
    • Covers Earth, life, physical, and general science
    • 5 comprehension and data analysis questions for each chart/graph
    • 4 Bonus graphs with 5 comprehension questions per chart/graph
    • Directions for assigning and using Google Slides™
    • Answer key (print only)

    YOU MIGHT BE INTERESTED IN

    Created by Classroom 214

    Follow my store to hear about new resources and sales. New resources are 50% off for the first 24 hours!

    Total Pages
    Answer Key
    Included
    Teaching Duration
    2 months
    Report this resource to TPT
    Reported resources will be reviewed by our team. Report this resource to let us know if this resource violates TPT’s content guidelines.

    Standards

    to see state-specific standards (only available in the US).
    Display numerical data in plots on a number line, including dot plots, histograms, and box plots.
    Describing the nature of the attribute under investigation, including how it was measured and its units of measurement.
    Use variables to represent two quantities in a real-world problem that change in relationship to one another; write an equation to express one quantity, thought of as the dependent variable, in terms of the other quantity, thought of as the independent variable. Analyze the relationship between the dependent and independent variables using graphs and tables, and relate these to the equation. For example, in a problem involving motion at constant speed, list and graph ordered pairs of distances and times, and write the equation 𝘥 = 65𝘵 to represent the relationship between distance and time.
    NGSSMS-ESS3-2
    Analyze and interpret data on natural hazards to forecast future catastrophic events and inform the development of technologies to mitigate their effects. Emphasis is on how some natural hazards, such as volcanic eruptions and severe weather, are preceded by phenomena that allow for reliable predictions, but others, such as earthquakes, occur suddenly and with no notice, and thus are not yet predictable. Examples of natural hazards can be taken from interior processes (such as earthquakes and volcanic eruptions), surface processes (such as mass wasting and tsunamis), or severe weather events (such as hurricanes, tornadoes, and floods). Examples of data can include the locations, magnitudes, and frequencies of the natural hazards. Examples of technologies can be global (such as satellite systems to monitor hurricanes or forest fires) or local (such as building basements in tornado-prone regions or reservoirs to mitigate droughts).
    NGSSMS-LS2-1
    Analyze and interpret data to provide evidence for the effects of resource availability on organisms and populations of organisms in an ecosystem. Emphasis is on cause and effect relationships between resources and growth of individual organisms and the numbers of organisms in ecosystems during periods of abundant and scarce resources.

    Reviews

    Questions & Answers

    1.1k Followers