39 results
Kindergarten graphing graphic organizer microsofts
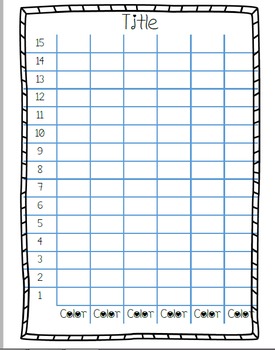
Blank Editable Graphs
These are blank graphs that you can edit by typing in the name of the graph and whatever objects are being graphed. There are bar graphs, a pie graph, and a line graph template.
Subjects:
Grades:
K - 3rd
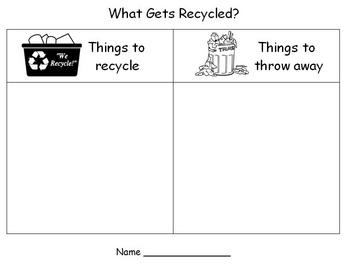
Earth Day - Recycling Sort
Kindergarten and first grade students will increase their knowledge of "Thinking Green" while strenthening their sorting and graphing skills as they complete this "What gets recycled" challenge. A great way to combine math and social studies.
Subjects:
Grades:
PreK - 4th
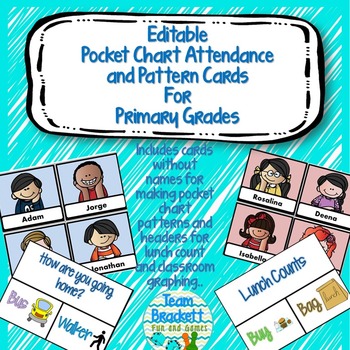
Pocket Chart Attendance and Pattern Cards for Primary Grades - editable
Give your students a sense of responsibility by having them record their attendance and other classroom data. The customizable cards can be used in a pocket chart for gathering data on attendance, lunch count, transportation and a number or other class routines. Blank header cards allow you to create your own data sets.
The cards include multicultural kids with visual clues for even the youngest students. Not only will your students love being able to move their own card to itps appropriate hea
Subjects:
Grades:
PreK - 5th
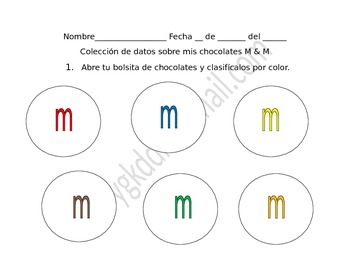
M and M math (fractions, tally marks, bar graph, pie graph, picture graph)
This activity includes:
1 sorting mat
1 tally marks worksheet
1 bar graph worksheet
1 picture graph worksheet
1 fractions worksheet
1 pie graph worksheet
I use this in my 1st grade dual language classroom.
Subjects:
Grades:
K - 2nd
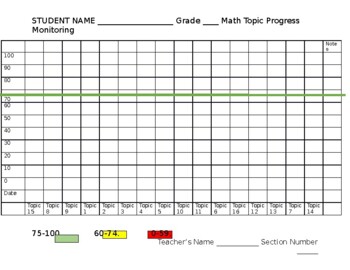
Math Data Tracker Topic Assessment and Progress Monitoring (Editable)
Students track their own progress in math topic assessments as a bar graph.75% - 100% is noted as proficient (students color in green)60%-74% is noted as average (students color in yellow)0%-59 % is noted as below average (students color in red)Edit teacher name, student name, section #, grade, math topic assessments etc.
Subjects:
Grades:
K - 12th
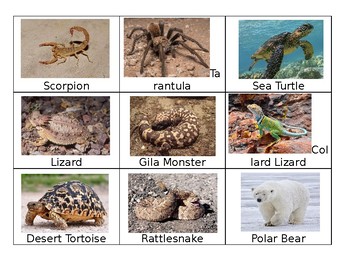
Desert Animals Vs. Non Desert
Use this document to learn about animals of the sonoran desert and compare them to animals that do not live in the desert.
Subjects:
Grades:
PreK - 4th
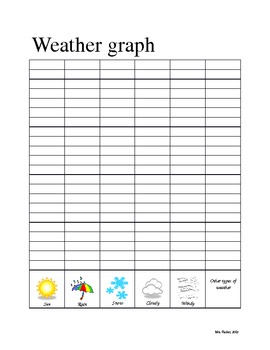
Kindergarten Weather Graph
Weather Graph
Chart daily weather
Aligns with Common Core Standards for Kindergarten.
Subjects:
Grades:
PreK - 1st
Math Data and Opinion Writing
This 55 page packet includes both colored work and black and white formats. Each set is 3 pages: 1. poster and/or class example of data graph, 2. students graph to write their data plus math comprehension and analysis questions, 3. Student writing assignment. This is a packet your students will sure to love! It is effective and fun!
Grades:
K - 6th

Minibeast Leg Graph
Students to count or research how many legs each minibeast has and colour the bar graph to reflect each amount.
Subjects:
Grades:
PreK - 2nd
Popsicle tally chart
A Tally Chart to be used for collecting data on favorite popsicle flavors.
Grades:
K - 3rd
Timed Fact Test Graphs
I use this graph in my classroom for students to track their progress during our timed fact tests. This helps them visually see their improvements and helps self motivate. I have included graphs for addition, subtraction, multiplication, and division.
Subjects:
Grades:
PreK - 8th
3 D shapes sorting worksheet
sorting 3-D shapes using a chart (sphere, cylinder, cube, cone)
Subjects:
Grades:
PreK - 2nd
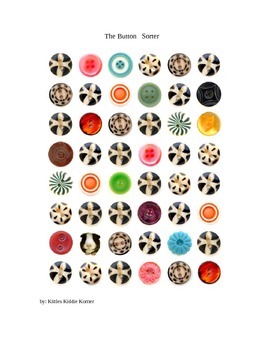
The Button sorter
This is the beginning of classification. This lesson starts out for Kindergarten and has application for the fourth or fifth grade. dichotomy charts and graphs are included.
Subjects:
Grades:
K - 4th
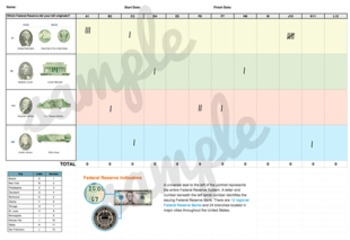
Which Federal Reserve Did My Bill Come From?
A tally sheet that is a great pre-cursor to any field trip or discussion on the Federal Reserve. Kiddos can learn how to identify which reserve the bill in thier wallet/purse comes from and over a period of time (determined by you), can tally where the bills are from that they and their parents use for transactions. Great project for students learning about money or economics!Comes as an Excel document, but you can export that into a PDF to print for your student where they can complete with a
Subjects:
Grades:
K - 12th
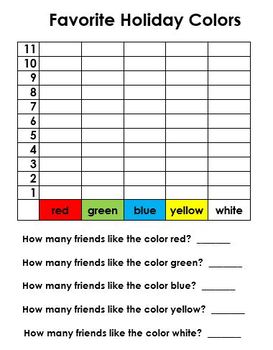
Fun with Graphing Activites
This package contains 29 pages of graphing worksheets.
Listed below are the various graphing worksheets:
• favorite summer activities • favorite holiday color
• favorite fish • favorite magnet activity
• favorite beach activities • favorite plant activity
• favorite outside activities • favorite animal group
• like living on a farm • favorite fall action activities
• favorite smells • favorite fall activities
• favorite tree leaves
Subjects:
Grades:
PreK - 2nd
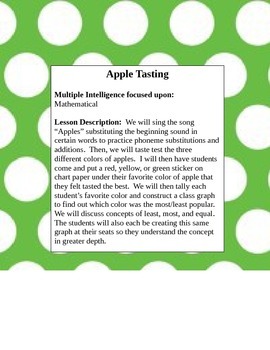
Apple Lessons
These are two apple lessons with lesson plans included in word format. The first is an apple graph worksheet I made to help students graph the class’ favorite kind of apple. The second goes along with the Dr. Suess story “Ten Apples up on Top”.
Printables---Apple Unit---Lesson Plans
Grades:
PreK - 1st
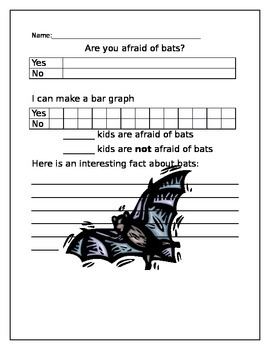
Student Interivews- Bat Unit
Used to finish a bat unit. Student interview each other with one easy question. Activity is easy to modify and extend. Great closure to a unit that promotes verbal participation from all learners. Fun for all students.
Subjects:
Grades:
K - 3rd
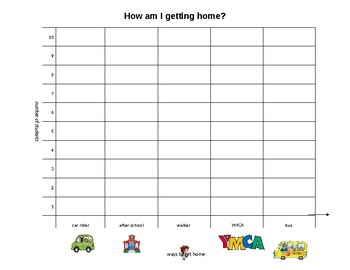
How am I getting home?
Students fill out graph with teachers about they are getting home the first day of school. This activity helps avoid any first day mix ups!
Subjects:
Grades:
PreK - 3rd

Counting Bones for Clifford
Use this graph while reading the book 'Counting on Clifford' Norman Bridwell. Students will count and glue either paper bones or real small dog bones onto the chart to demonstrate number recognition and 1:1 correspondence.
Subjects:
Grades:
PreK - K
Editable Graphing Your Age
This is an online way to graph students ages. This item is editable. You can type in names, add pictures, and change the age groups. This is a great way to engage your online learners with something personalized to them, yet still teach graphing.
Subjects:
Grades:
PreK - K
Types:
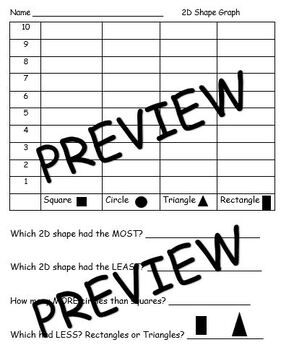
2D and 3D shape graphs
Provide students with pre-determined number of 2D and 3D shapes. Students graph the shapes and answer graph questions.
Grades:
PreK - K
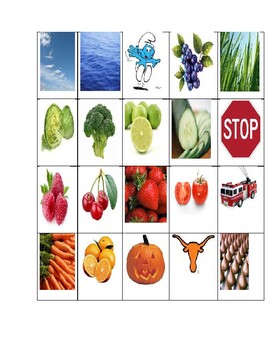
Sorting Colors
This document can be used for sorting colors and making a graph. I have the students cut the pictures out and then sort on a graph.
Grades:
PreK - K

Lion and Lamb Predictions
Start off March using this March predictions worksheet with your kiddos! It has 20 spots on it for graphing and has questions on the next page. I cannot wait to use it!
Grades:
PreK - 3rd

Classroom Jobs Apple Grid
Here is a fun way to assign classroom jobs and at the same time teach or reinforce graphing skills.
Subjects:
Grades:
K - 6th
Showing 1-24 of 39 results


