20 results
Common Core HSS-ID.A.2 assessments for Microsoft Word
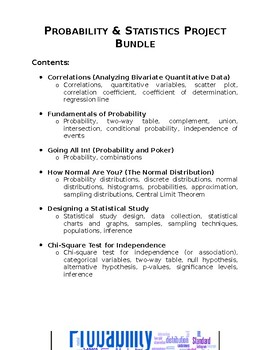
Probability & Statistics Project Bundle
A bundle that contains six different projects for a Probability & Statistics high school course. This bundle includes: Correlations (Analyzing Bivariate Quantitative Data) Fundamentals of Probability Going All In! (Probability, Combinations, and Poker) How Normal Are You? (The Normal Distribution) Designing a Statistical Study Chi-Square Test for Independence These projects are designed to engage students in authentic, hands-on, performance-based tasks. For each of these projects, students c
Subjects:
Grades:
9th - 12th
Types:
CCSS:
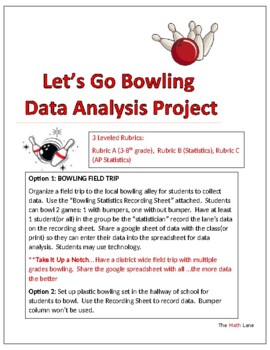
Let's Go Bowling Statistics STEM Project & Field Trip (3-12 and AP Stat)
Great END OF YEAR project. Get ready to strike up some fun with your students on a field trip to the bowling alley or right in your own hallway with a plastic bowling set! This isn't just any ordinary field trip - it's a real-world data collection extravaganza. 3 different leveled rubrics (Grade 4-10, Statistics, AP Statistics) so students can analyze the data based on their math knowledge. Students will be able to practice creating and analyzing graphical displays, scatterplots, construct c
Subjects:
Grades:
Not Grade Specific
Types:
Also included in: High School Statistics Project Bundle
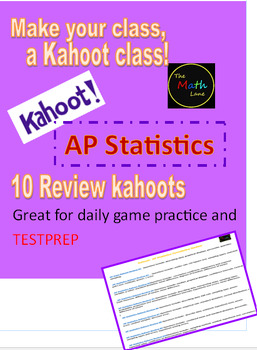
AP Statistics Kahoots (10 total): No Prep game/activity for AP Statistics Exam
Get ready to supercharge your AP Statistics exam prep with these 10 Kahoot links! With 10-15 questions in each Kahoot, your students will have daily practice to help them ace the exam at the end of the year. These Kahoots are specifically designed using AP test material, so you can be sure your students are getting the best preparation possible. Perfect for quick spiral review, warm-ups, or closing out class, these Kahoots are the ultimate tool for helping your students succeed. And with the opt
Subjects:
Grades:
10th - 12th
Types:
CCSS:
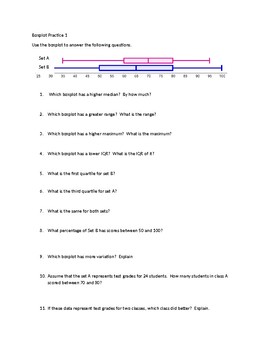
Boxplot Practice
This contains 5 boxplot worksheets analyzing, comparing and describing two boxplots. There are 3 easier ones and 2 that are more advanced. Students will have to identify and compare median, range, IQR, quartiles, minimum and maximum. They will interpret which has more variation and be able to interpret which set of scores is better. The worksheets are created in Word and the questions are fully editable. The first three can be used in middle school math or Algebra I. The 2 that are more ad
Subjects:
Grades:
6th - 12th
Types:
CCSS:
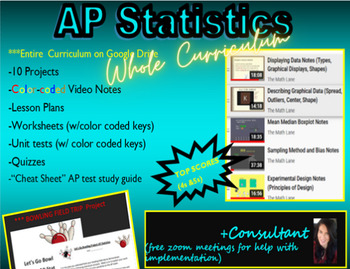
AP Statistics/Stats FULL Curriculum LINK (notes, wksts, PROJECTS) and Consultant
Get ready to supercharge your students' AP Statistics experience with this dynamic curriculum! With over 50% of students earning 4s or 5s on the AP exam, this program is proven to deliver top results. Featuring color-coded video notes, worksheets, activities, and 10 engaging projects, this curriculum is designed to keep students engaged and excited about statistics. Plus, with a Bowling Field Trip Project Opportunity included, students will have the chance to apply their knowledge in a real-worl
Subjects:
Grades:
10th - 12th
CCSS:
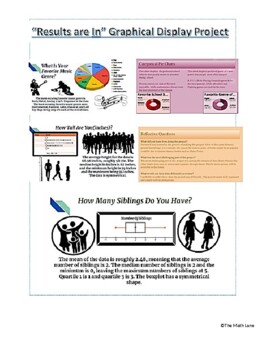
"The Results are In" Graphical Display Stats End of Year Project (All Grades)
Get ready to take your data analysis skills to the next level with our Graphical Display Project! Designed for students who want to create visually stunning displays of their data, this project allows you to not only collect data using Google Surveys, but also analyze and present it using Google Sheets. With detailed instructions, project examples, and a comprehensive rubric included, you'll have everything you need to create professional-looking graphical displays of both numerical and categori
Subjects:
Grades:
Not Grade Specific
Types:
CCSS:
Also included in: High School Math Projects (Algebra II and Statistics) STEM No prep
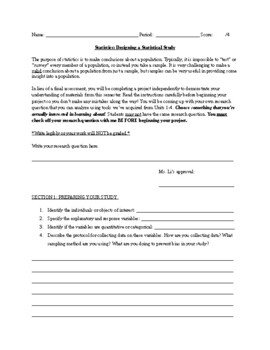
Statistics Project: Designing a Linear Regression Analysis (High School)
Updated as of 5/28 with graphic organizers and sentence starters. Hello!I've designed a statistics project that students in my class loved! This project requires students to collect data on a topic that interests them. They have to design a sampling method that is as unbiased as possible. Students are then required to analyze their data and summary statistics. They also need to do a regression analysis on their study and make inferences using their results. This is perfect for a replacement of
Subjects:
Grades:
9th - 12th, Higher Education
Types:
CCSS:
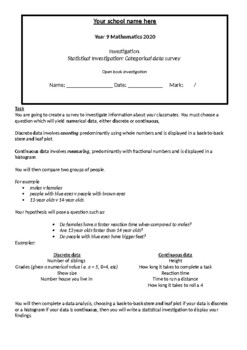
Year 9 Mathematics Statistical Investigation - Histogram & Stem & Leaf plots
Year 9 Investigation – Histograms a Back-to-back Stem and Leaf PlotsStudents will complete a full statistical report, including introduction, data analysis, data interpretation and conclusion, using back to back stem and leaf plots or histograms to compare groups of people.Students are to create their own hypothesis, create a survey and analyse the data they collect. Included on the task sheet is a list of possible hypotheses.Students are to compare the shape (skew) and location (mean, median, m
Subjects:
Grades:
10th
Types:
CCSS:
Also included in: Year 9 Mathematics Assessments
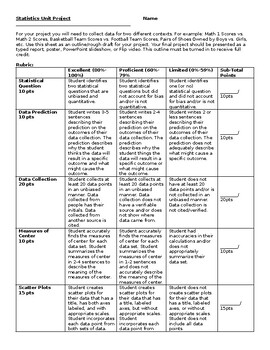
Math 1 Statistics Project
Math 1 Statistics Project Included Items:- Editable file in Microsoft Word- Rubric for project- Students collect two sets of data (either from people or online)- Measures of Center- Measures of Spread- Scatter Plot- Linear Regression- Dot Plot OR Histogram for Distribution- Double Box Plot/5-Number Summary- Summary of Findings Page- 6 pages altogetherRecommendations:1. I went through the project outline with my students.2. If you don't want your students to present, they can make a Flip video wi
Grades:
8th - 10th
Types:
CCSS:
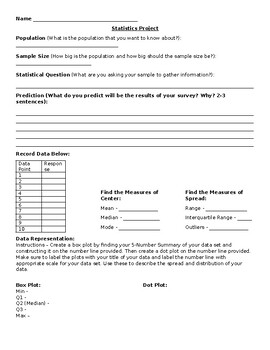
Statistics Project
Statistics Project Details:- Editable in Microsoft Word- Includes decisions on population and sample size- Spaces for 10 data points (this is meant for a smaller population)- Measures of Center- Measures of Spread- Box Plot- Dot Plot- Distribution of Data- Summary prompts- Final product Flip instructionsRecommendations:1. Review the project with the students before having them start.2. Discuss what types of questions to ask to make sure you get QUANTITATIVE data.3. If students do research to fin
Subjects:
Grades:
7th - 9th
Types:
CCSS:
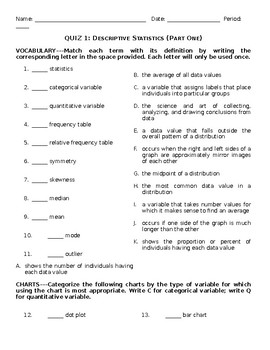
Mid-Chapter Quizzes: Descriptive Statistics
Includes two quizzes and answer keys covering topics in a unit on descriptive statistics. Topics include: mean, median, mode, bar charts, dot plots, histograms, outliers, correlations, quantitative variables, categorical variables, symmetry, skewness. These quizzes are mostly vocabulary, with a few short answer questions.
Subjects:
Grades:
9th - 12th
Types:
CCSS:
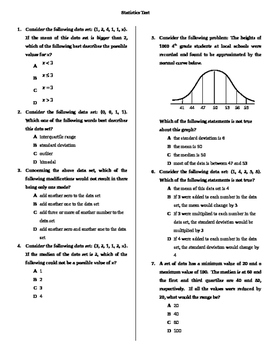
Statistics (Algebra) Test
Twelve multiple-choice, higher-level thinking questions covering topics of outliers, trends, mean, median, variance, range, standard deviation, and various graphical representations of data. Good stuff.
Subjects:
Grades:
9th - 12th
Types:
CCSS:
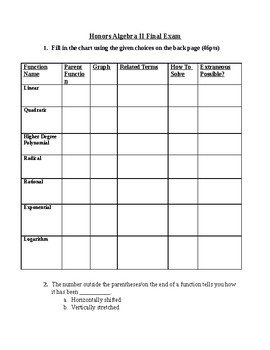
Honors Algebra 2 Final Exam
This is a concept based final exam suitable for average to honors level Algebra 2 curricula. It follows basic common core skill sets and includes probability, number sets, standard distribution, and two-way tables but not trigonometry. I use it as an assessment for the students I home-school and study guide for students in public or private school settings. The first section involves matching graphs, key terms/skills, and parent equations to the various functions introduced in Algebra 2. The voc
Subjects:
Grades:
10th - 12th
CCSS:
Also included in: Algebra 2 Bundle
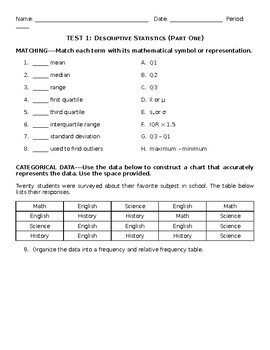
Mid-Unit Test: Descriptive Statistics
This test was used halfway through a unit on descriptive statistics and covers a wide range of topics. It asks students to organize data into frequency tables, display data in charts (bar chart, histogram, dot plot, box plot), and analyze quantitative data (outliers, skew, center). (Note: This test was used between my quizzes, which are also available in my store. The quizzes focused more on recognition and some application of vocabulary concepts; this test has students more extensively apply th
Subjects:
Grades:
9th - 12th
Types:
CCSS:
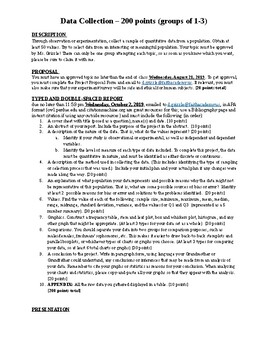
Bluman Statistics Chapters 1-3 Cumulative Project
This is a Microsoft Word document, so it can be edited to fit your own classroom needs. It is a project I used in my 12th grade Statistics class. I gave it out the second week of the quarter and set aside one day a week to work with my students on this project through all of first quarter. This project is aligned with chapters 1-3 of Elementary Statistics: A Step by Step Approach 8th edition, but can be adapted to fit any Statistics textbook. Specifically, this project includes descriptive and i
Subjects:
Grades:
11th - 12th, Higher Education
Types:
CCSS:
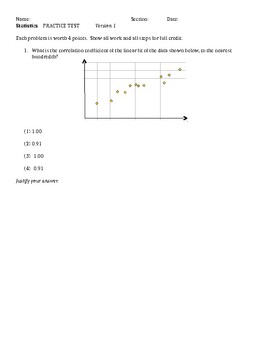
Algebra 1 Tests- Statistics Unit - 3 versions
Included are 3 versions of an Algebra 1 Unit Test on Statistics. The main topics being assessed are interpreting the correlation coefficient, comparing and computing measures of central tendency, finding the least squares regression line and making predictions, constructing a box and whisker plot, using quadratic regression and constructing and interpreting a residual graph. Each version is very similar to the others; the problems have different numbers but the type and level of problem is the
Subjects:
Grades:
8th - 10th, Staff
Types:
CCSS:
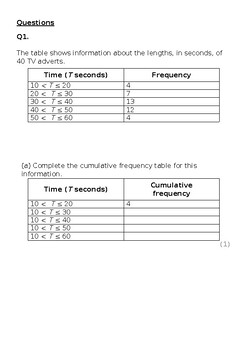
EXAM: DATA HANDLING
This exam of 155 marks follows the topic of data handling. It has twenty seven questions in a word format. It covers the topics of graphical data handling, frequency and mean, mode etc.
Subjects:
Grades:
9th - 11th
Types:
CCSS:
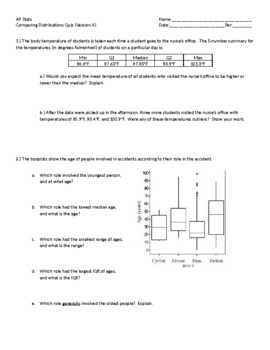
AP Statistics: Comparing Distributions Quiz
This quiz assesses student understanding of shapes of distributions, measures of central tendency, and measures of spread as well as being able to compare these features across multiple distributions. There are open-ended questions that require both statistical computations as well as critical analysis of these computations. There are two versions of the quiz with attached answered keys. AP Statistics Unit 1: Exploring One-Variable Data.
Subjects:
Grades:
10th - 12th
Types:
CCSS:
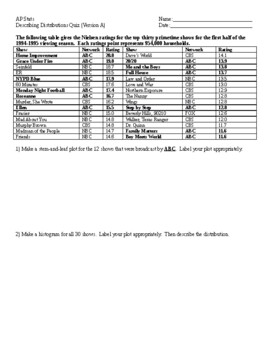
AP Statistics: Describing Distributions Quiz
This quiz assesses student understanding of shapes of distributions, measures of central tendency, and measures of spread. There are open-ended questions that require both statistical computations as well as critical analysis of these computations. There are two versions of the quiz with attached answered keys. AP Statistics Unit 1: Exploring One-Variable Data.
Subjects:
Grades:
10th - 12th
Types:
CCSS:
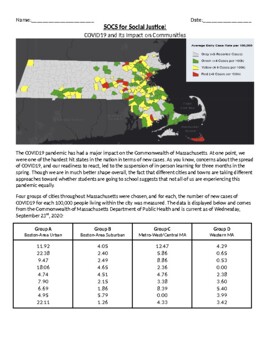
SOCS for Social Justice: Analyzing the Impact on COVID-19 in Massachusetts
The COVID-19 pandemic has undoubtedly impacted Massachusetts, with over 10,000 dead (as of the time this was posted) and hundreds of thousands sickened. What's worse, as epidemiologists have pointed out, is that the pandemic may not be impacting everyone equally. Some have observed that people of color and/or people from low-income communities may be disproportionately impacted. But can we use data to show whether or not this is true?In this activity, students use REAL data from the Massachusett
Subjects:
Grades:
Not Grade Specific
Types:
CCSS:
Showing 1-20 of 20 results

