5 results
Common Core HSS-ID.A.2 lessons for Microsoft Word

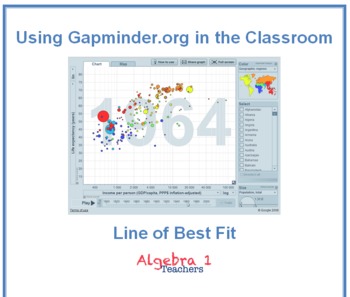
Gapminder: Line of Best Fit
Gapminder.com is a very powerful data analysis tool that uses the most current data to allow everyone to look at trends within our world. It is a great learning tool, but if your students are anything like mine, they need direction and structure. I created this lesson to help my students understand this powerful tool at the basic level so that we can use it to investigate statistics in my Algebra 1 class. This will also help cover S.Q.2 from the Common Core for Algebra 1.
Please check back soon
Grades:
8th - 10th
Types:
CCSS:

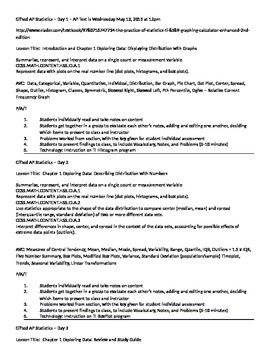
AP Statistics Lesson Plans for 29 Days with CCSS Included
Lesson Plans for High School teachers of AP Statistics. Includes the first half of the course. Common Core State Standards are included for every lesson. Easy to copy and paste into school district lesson plan site. Includes technology, group work, peer evaluation, independent study, and a common sense approach to the day by day student lead teaching of the AP Statistics course. Great template for COMPASS.
Subjects:
Grades:
12th, Higher Education
Types:
CCSS:

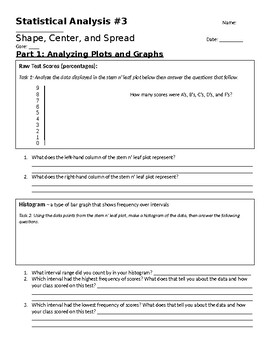
Statistical Analysis #3: Shape, Center, and Spread
I teach statistics by spiraling it throughout the year. After each unit test or benchmark, students analyze their own assessment data through a statistical lens. The third Statistical Analysis that students complete reinforces the four statistical measures from SA #1 (mean, median, mode, and range) and connects that understanding to shape, center, and spread while also introducing the stem n' leaf plot and histogram.SA #3 starts by providing the raw test data through a stem n' leaf plot. Student
Subjects:
Grades:
6th - 9th
Types:
Also included in: Statistical Analyses Package

Statistical Analyses Package
I teach statistics by spiraling it throughout the year. After each unit test or benchmark, students analyze their own assessment data through a statistical lens, which helps students to understand statistics in a way that is incredibly relevant and engaging. It feeds their natural curiosity because they want to discover how the class performed on that recent test, and they get hooked on the statistics. These activities are designed to encourage critical thinking as well as reflection on students
Subjects:
Grades:
6th - 9th
Types:

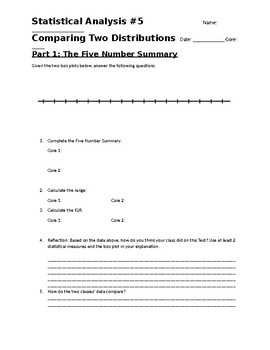
Statistical Analysis #5: Comparing Two Distributions
I teach statistics by spiraling it throughout the year. After each unit test or benchmark, students analyze their own assessment data through a statistical lens. The fifth Statistical Analysis that students complete reinforces the statistical measures of center (mean, median, mode) and spread (range, IQR), as well as determining shape through various plots and graphs. SA #5 reviews the plots previously discussed (stem n' leaf, histogram, and box plot), but also introduces the dot plot. In additi
Subjects:
Grades:
6th - 9th
Types:
CCSS:
Also included in: Statistical Analyses Package
Showing 1-5 of 5 results

