TPT
Total:
$0.00

AP Statistics/Stats FULL Curriculum LINK (notes, wksts, PROJECTS) and Consultant

;
The Math Lane
17 Followers
Grade Levels
10th - 12th
Standards
Formats Included
  • Word Document File
$300.00
$300.00
Share this resource
Report this resource to TPT
The Math Lane
17 Followers

Description

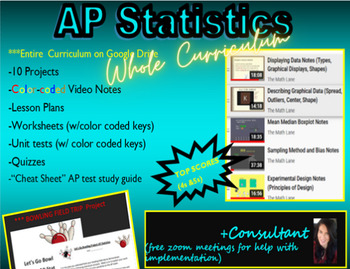
Get ready to supercharge your students' AP Statistics experience with this dynamic curriculum! With over 50% of students earning 4s or 5s on the AP exam, this program is proven to deliver top results. Featuring color-coded video notes, worksheets, activities, and 10 engaging projects, this curriculum is designed to keep students engaged and excited about statistics. Plus, with a Bowling Field Trip Project Opportunity included, students will have the chance to apply their knowledge in a real-world setting. Keys are color-coded for easy grading, making assessment a breeze. And with access to a Google Drive link after purchase, you'll have all the resources you need at your fingertips. But that's not all - I also offer personalized coaching and Zoom meetings to help you make the most of these resources and ensure your students succeed. Whether you're working with SPED or ESL students, this curriculum is adaptable and effective for all learners. Don't settle for average results - give your students the tools they need to excel in AP Statistics!

Total Pages
Answer Key
Included
Teaching Duration
N/A
Report this resource to TPT
Reported resources will be reviewed by our team. Report this resource to let us know if this resource violates TPT’s content guidelines.

Standards

to see state-specific standards (only available in the US).
Represent data with plots on the real number line (dot plots, histograms, and box plots).
Use statistics appropriate to the shape of the data distribution to compare center (median, mean) and spread (interquartile range, standard deviation) of two or more different data sets.
Interpret differences in shape, center, and spread in the context of the data sets, accounting for possible effects of extreme data points (outliers).
Use the mean and standard deviation of a data set to fit it to a normal distribution and to estimate population percentages. Recognize that there are data sets for which such a procedure is not appropriate. Use calculators, spreadsheets, and tables to estimate areas under the normal curve.
Summarize categorical data for two categories in two-way frequency tables. Interpret relative frequencies in the context of the data (including joint, marginal, and conditional relative frequencies). Recognize possible associations and trends in the data.

Reviews

Questions & Answers

17 Followers