
"The Results are In" Graphical Display Stats End of Year Project (All Grades)


- Word Document File
Also included in
 Get ready to take your math curriculum to the next level with our 11 supercharged math projects! These projects are designed to help students make real-world connections to psychology, art, population growth/decay, traveling, college, and statistics. Each project comes with detailed descriptions, piPrice $37.10Original Price $53.00Save $15.90
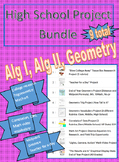 Get ready to take your math class to the next level with this supercharged bundle of 9 exciting math projects! Students will have the opportunity to connect math to real-world scenarios including data analysis, population growth/decay, traveling, heights, and even college search. Each project comesPrice $30.00Original Price $43.00Save $13.00
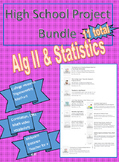
 Get ready to supercharge your statistics curriculum with these 8 dynamic projects designed to engage and challenge your students! From collecting and analyzing data using Google Forms and Sheets in 'The Results are In' to exploring correlations with scatterplots and LSRL in 'Is There a Correlation?'Price $27.00Original Price $42.00Save $15.00
Description
Get ready to take your data analysis skills to the next level with our Graphical Display Project! Designed for students who want to create visually stunning displays of their data, this project allows you to not only collect data using Google Surveys, but also analyze and present it using Google Sheets. With detailed instructions, project examples, and a comprehensive rubric included, you'll have everything you need to create professional-looking graphical displays of both numerical and categorical data. Whether you're a beginner looking to sharpen your skills or an experienced data analyst wanting to showcase your expertise, this project is perfect for you. Don't miss out on this opportunity to elevate your data analysis game. Order now and start creating eye-catching graphical displays that will impress your teachers and classmates!
