86 results
Common Core HSS-ID.A.2 internet activities for Microsoft Word
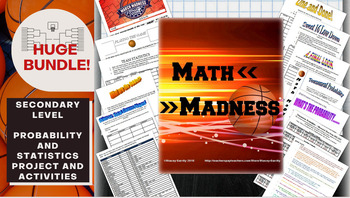
Math March Madness Full Tournament Project {BUNDLE}
Harness the excitement of NCAA March Madness with this huge project for secondary math teachers that follows all stages of the tournament! This Common Core aligned bundle comes with bonus parts not sold individually in my store so you can create a rich immersion in the tournament, practice probability and statistics and learn some interesting new ones along the way! Save $3 plus get bonus content by bundling!You can pick and choose which parts you would like to incorporate, or follow my schedu
Subjects:
Grades:
6th - 12th, Higher Education
Types:
High School Math Common Core Aligned IEP Goal Bank
This IEP goal bank was created to assist special education teachers with the task of writing standards-based IEP goals in math. After spending countless hours developing IEP goals myself and really having to think through how to best individualize goals and objectives for my own students, I wanted to share this resource to help other special education teachers gain back some of their time.This goal bank includes the following:An introduction and guide that explains how to use the document.Each s
Subjects:
Grades:
9th - 12th
CCSS:
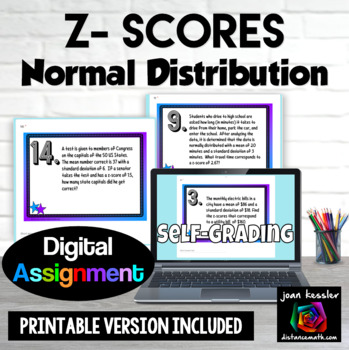
Normal Distribution Z-Scores Digital plus Print
Your students will get extra practice and gain fluency learning about z-scores and the Normal Distribution with both a self-grading digital resource and a PDF printable version. There are 16 applications to solve with a mix of multiple choice and free response including: finding the z-scorefinding the standard deviation knowing the z-score, mean, and data point finding the mean knowing the z-score, data point, and standard deviationinterpreting the z-score. Your download includes:PDF with link
Subjects:
Grades:
9th - 12th
Types:
CCSS:
Also included in: Probability and Statistics Algebra 2 Unit 11 Activity Bundle
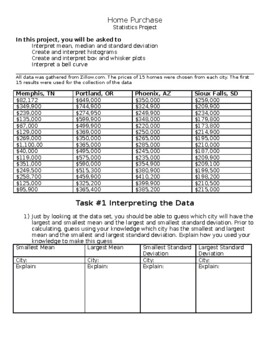
Home Prices: High School Statistics Project
This statistics project has students exploring home prices and using their knowledge of mean, median, standard deviation, histograms, box and whisker plots, and bell curves to make predictions and inferences about the data. This project is provided in a word document to allow the teacher the ability to edit the document or load it to a google doc. In this project students first make predictions about measures of spread and central tendency without calculating but by looking at the data. Students
Subjects:
Grades:
9th - 12th
Types:
CCSS:

Measures of Center and Spread |Mean, Median, Standard Deviation, +|Google Forms™
Included in this Product: 100% Self-Grading Assessment or Homework using Google Forms™ - Measures of Center and Spread - Mean, Median, Range, Interquartile Range, Standard Deviation - 26 Questions each (9 multiple choice, 15 free response, and 2 checkbox). The default multiple choice answer order is generally set to be "shuffled" to prevent cheating. However, this can be edited. 2 similar versions for the price of 1!! Having a second version of the form allows for retakes and also gives you opt
Subjects:
Grades:
8th - 12th
Types:
CCSS:
Also included in: Algebra 2 Google Forms™
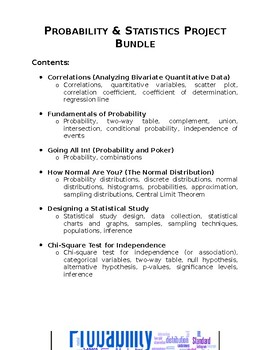
Probability & Statistics Project Bundle
A bundle that contains six different projects for a Probability & Statistics high school course. This bundle includes: Correlations (Analyzing Bivariate Quantitative Data) Fundamentals of Probability Going All In! (Probability, Combinations, and Poker) How Normal Are You? (The Normal Distribution) Designing a Statistical Study Chi-Square Test for Independence These projects are designed to engage students in authentic, hands-on, performance-based tasks. For each of these projects, students c
Subjects:
Grades:
9th - 12th
Types:
CCSS:
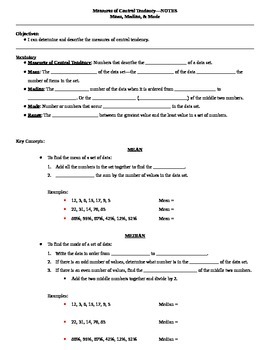
Measures of Central Tendency Guided Notes
These are guided notes for a lesson on measures of central tendency including mean, median, mode, and range. There are several examples in the notes and the same data sets are used to show each measure of central tendency.I have also included a teacher key to show you what to fill in the blanks as your students follow along.To use these notes, I simply projected them onto my whiteboard, gave the students their blank copies, and had them follow along and write what I wrote. This works great when
Subjects:
Grades:
5th - 12th
CCSS:
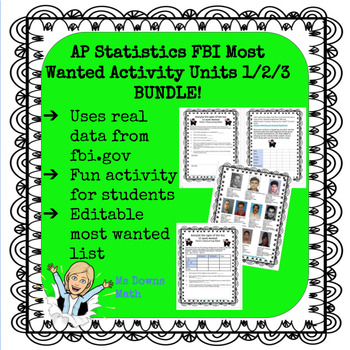
FBI Most Wanted AP Stat - Analyze Data, Normal Distributions, Linear Regression
I have created a series of activities for several units in the AP Statistics curriculum. The students love using data from fbi.gov to review concepts. This activity involves analyzing data related to the top 10 most wanted fugitives. I created this activity in May of 2020 and used the top 10 at that time. In the folder, you will find an editable slide of the top 10 if you want to change it.The answer key for the unit is based on the original top 10 that I used. Teachers have the option of having
Subjects:
Grades:
10th - 12th
Types:
CCSS:

Entrepreneur's Startup Challenge: Interactive Middle School Business Simulation
THE STARTUP is a Business Entrepreneurship project that uses Google Workspace and other FREE online tools. It's perfect for Middle and High School and introduces students to the power principles of entrepreneurship through online business creation! Students will be introduced to the following principles of entrepreneurship:What is an entrepreneur?What need do I see in the marketplace?How can I use my individual interests and talents to meet the needs of others?How can I provide value and be paid
Subjects:
Grades:
6th - 12th
Types:
CCSS:
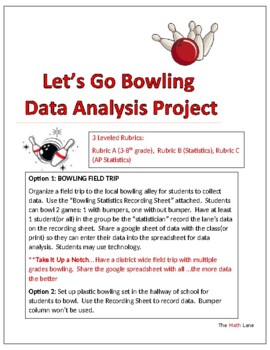
Let's Go Bowling Statistics STEM Project & Field Trip (3-12 and AP Stat)
Great END OF YEAR project. Get ready to strike up some fun with your students on a field trip to the bowling alley or right in your own hallway with a plastic bowling set! This isn't just any ordinary field trip - it's a real-world data collection extravaganza. 3 different leveled rubrics (Grade 4-10, Statistics, AP Statistics) so students can analyze the data based on their math knowledge. Students will be able to practice creating and analyzing graphical displays, scatterplots, construct c
Subjects:
Grades:
Not Grade Specific
Types:
Also included in: High School Statistics Project Bundle
High School Math IEP Goal Bank - Statistics and Probability
This IEP goal bank was created to assist special education teachers with the task of writing standards-based IEP goals in math. After spending countless hours developing IEP goals myself and really having to think through how to best individualize goals and objectives for my own students, I wanted to share this resource to help other special education teachers gain back some of their time.This goal bank includes the following:An introduction and guide that explains how to use the document.Each s
Subjects:
Grades:
9th - 12th
CCSS:
AP Statistics Kahoots (10 total): No Prep game/activity for AP Statistics Exam
Get ready to supercharge your AP Statistics exam prep with these 10 Kahoot links! With 10-15 questions in each Kahoot, your students will have daily practice to help them ace the exam at the end of the year. These Kahoots are specifically designed using AP test material, so you can be sure your students are getting the best preparation possible. Perfect for quick spiral review, warm-ups, or closing out class, these Kahoots are the ultimate tool for helping your students succeed. And with the opt
Subjects:
Grades:
10th - 12th
Types:
CCSS:

Algebra 1 Discovery Lessons and Hands-On Activities
Looking for engaging ways to get your students to discover concepts in Algebra 1? These five activities will help your students develop deeper understanding with hands-on activities for measure of center, regression and residuals, solving by substitution, graphing piecewise functions and function transformation rules. Why get the bundle? ⭐ Save 20% on these tried and true activities!⭐ Get a variety of activities that you can use throughout the year.⭐ Unique and simple engaging activities for som
Grades:
8th - 9th
Types:
CCSS:
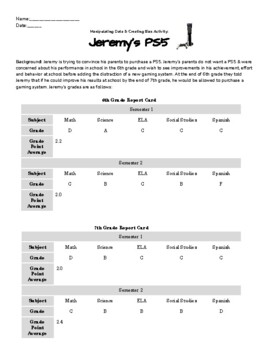
Manipulating Data & Creating Bias Activity
Manipulating Data & Creating Bias Activity: Teach your students about how charts and statistics can be skewed; and real numbers can reflect bias with this fun project! Students are given a role (either Jeremy or his parents) and have to use two pieces of data from Jeremy's 6th & 7th grade report card to argue for or against his deserving of a PS5!Students get to be creative & make cross-curricular connections to ELA as they use logical fallacies & skewed graphs to make their argu
Subjects:
Grades:
4th - 11th
Types:
CCSS:
NGSS:
HS-ETS1-4
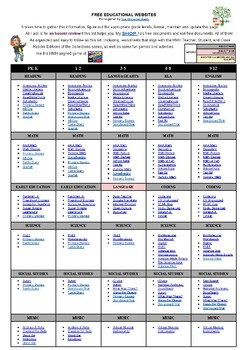
FREE EDUCATIONAL WEBSITES LIST 4 ALL GRADES K-12 AND SUBJECTS + TEACHER RESOURCE
Sometimes, you just need a list of websites for everyone. Here it is. FREE EDUCATIONAL WEBSITES Put together by Teach Me, Maria!It takes time to gather this information, figure out the appropriate grade levels, and format, maintain, and update this page. All I ask is for an honest review if this list helps you.
Subjects:
Grades:
PreK - 12th, Staff
Types:
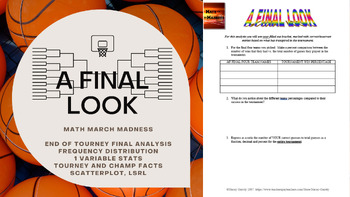
Math March Madness - A Final Look (Freq Distributions, Stats, Regression Lines)
Fill out a bracket, watch the tournament unfold and then mathematically analyze how you did! This activity is flexible enough to be used for a variety of levels. I have used all 6 pages for an AP Statistics class, and have used pages 1 through 5 for an Algebra or Algebra 2 class. You could even use it in lower levels as long as you are covering percents, and basic stats like mean, median, mode and graphing. The document is editable so you can adjust/delete to tailor to the level of statistic
Subjects:
Grades:
4th - 12th, Higher Education
Types:
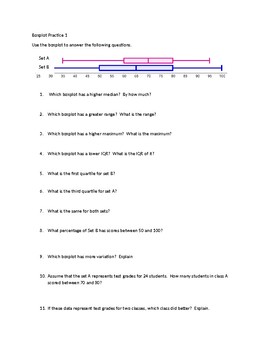
Boxplot Practice
This contains 5 boxplot worksheets analyzing, comparing and describing two boxplots. There are 3 easier ones and 2 that are more advanced. Students will have to identify and compare median, range, IQR, quartiles, minimum and maximum. They will interpret which has more variation and be able to interpret which set of scores is better. The worksheets are created in Word and the questions are fully editable. The first three can be used in middle school math or Algebra I. The 2 that are more ad
Subjects:
Grades:
6th - 12th
Types:
CCSS:
TPC GMAS (Georgia) 2024 Algebra 1 Practice Set #1
Learn how to use the official Desmos Graphing Calculator for the Georgia Milestones Assessment for Algebra 1.The items in this practice set are modeled after the items that appear in the official Georgia Online practice test.For the best results, follow these guidelines.Students will need a device and internet access and should...1. Access the items from the GMAS training site. Georgia Milestones Online Training Tools Site.2. View the accompanying YouTube Videos as they work through select item
Grades:
7th - 10th
Types:
CCSS:
Also included in: TPC #GMAS Algebra 1 Bundle
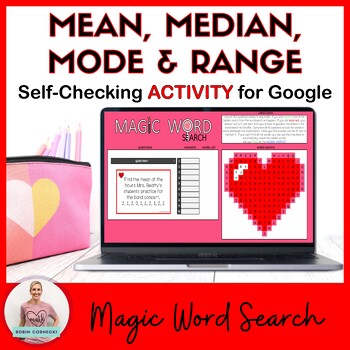
Mean Median Mode Range Digital|Printable Valentine's Day Activity for Algebra
Give your students a fun and engaging way to practice Mean, Median, Mode, and Range (measures of central tendency) with this Self-Checking Digital and Printable Magic Word Search activity. There are 10 questions that students will find the mean, median, mode, and range of real-world scenarios. ➡️The questions are a task card so the students will only see 1 question at a time. ✅This resource is perfect for Distance Learning (zero prep) or in the classroom. There is a worksheet that you can use
Subjects:
Grades:
7th - 9th
Types:
CCSS:
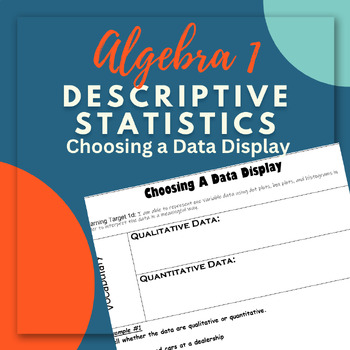
Choosing a Data Display
This is an editable copy of a notes outline for Algebra 1. This outline is designed to be used within the Descriptive Statistics Unit. These notes cover choosing the best way to display your data and misleading graphs that can create bias. Check out my other notes outlines and my student reflection tools that align with the notes for each unit!
Subjects:
Grades:
9th - 12th
CCSS:
Also included in: Descriptive Statistics Notes and Student Reflection Bundle
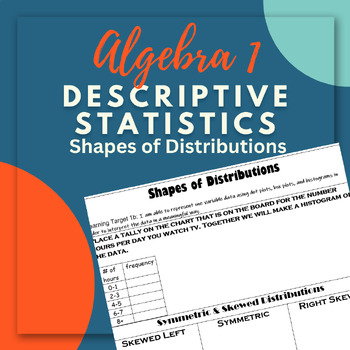
Shapes of Distributions Notes Outline
This is an editable copy of a notes outline for Algebra 1. This outline is designed to be used within the Descriptive Statistics Unit. These notes cover the shapes of distributions of data. Check out my other notes outlines and my student reflection tools that align with the notes for each unit!
Subjects:
Grades:
9th - 12th
Types:
CCSS:
Also included in: Descriptive Statistics Notes and Student Reflection Bundle
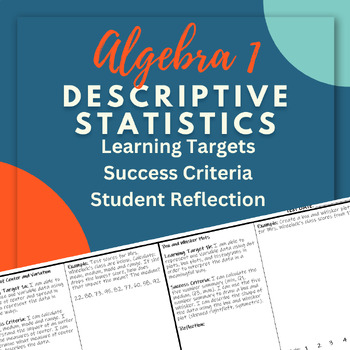
Descriptive Statistics Student Reflections
This is an editable copy of a student reflection sheet for Algebra 1. This reflection page is designed to go with the Descriptive Statistics Unit. The handout has learning targets, success criteria, student self assessment and reflection opportunities. These can be used for ongoing reflection throughout the unit or at the end of the unit as a form of review. Check out my notes outlines that align with these reflections or the unit bundle is available too!
Subjects:
Grades:
9th - 12th
Types:
CCSS:
Also included in: Descriptive Statistics Notes and Student Reflection Bundle
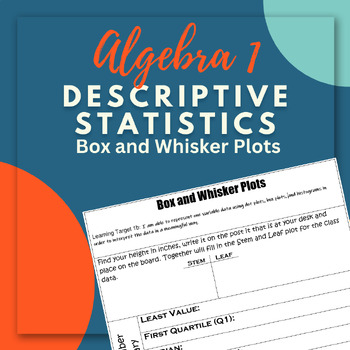
Box and Whisker Plots Notes Outline
This is an editable copy of a notes outline for Algebra 1. This outline is designed to be used within the Descriptive Statistics Unit. These notes cover box and whisker plots. Check out my other notes outlines and my student reflection tools that align with the notes for each unit!
Subjects:
Grades:
9th - 12th
Types:
CCSS:
Also included in: Descriptive Statistics Notes and Student Reflection Bundle
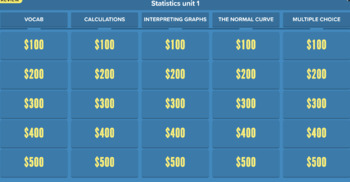
AP stats Unit 1 review jeopardy-style game
Included in purchase is the answer key in order (Category 1 $100-500, category 2 $100-500, etc.) and the link to the jeopardy game website. Membership is not needed to play on the website, but you will need to upgrade to pro on their site if you want the buzzer mode (not necessary but fun if your students are very competitive) follows Unit one vocab and example problems of AP Statistics (Categorical and quantitative data, normal curve)
Subjects:
Grades:
11th - 12th
Types:
CCSS:
Showing 1-24 of 86 results

