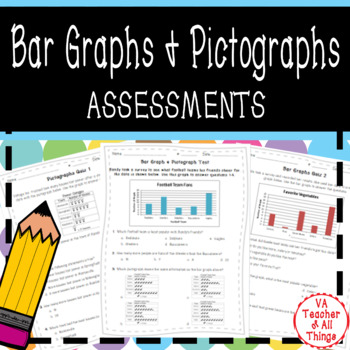
Reading Bar Graphs and Pictographs Assessments SOL 3.15
VATeacherofAllThings
578 Followers
Grade Levels
2nd - 4th
Subjects
Resource Type
Standards
CCSS2.MD.D.10
CCSS3.MD.B.3
Formats Included
- PDF
- Easel Activity
Pages
19 pages
VATeacherofAllThings
578 Followers
Easel Activity Included
This resource includes a ready-to-use interactive activity students can complete on any device. Easel by TPT is free to use! Learn more.
What educators are saying
This assessment gave me a good picture about where my students were with understanding bar and picto graphs. It helped me to determine where I need to work with them in small group and how to differentiate the following instruction.
Thank you so much. I supplemented the actual lesson book with this because it was way more engaging for my students. I am so grateful to for creating these activities.
Also included in
- A bundle to help you build and teach your data and graphing unit! This bundle includes: 20 printable task cards on pictographs and bar graphs32 digital interactive task cards on pictographs and bar graphsAssessments for the evaluation of student progress throughout the unit. 2 Two 6 question quizzesPrice $6.20Original Price $7.75Save $1.55
Description
Test your students' ability to read and create bar graphs and pictographs of varying scales using these 4 quizzes and 1 test. Aligns with Virginia math SOL standard 3.15.
Product Includes:
- Two 6 question quizzes on reading bar graphs (each with one "bonus" 7th question)
- Two 6 question quizzes on reading pictographs (each with one "bonus" 7th question)
- One 20 question test on reading and creating bar graphs and pictographs combined (The test is easily printable as two 10-question quizzes or tests if you prefer)
- Easel activity of assessments listed above with self-checking multiple choice questions
Perfect for formative or summative assessments of your students' learning throughout the unit!
Types of Questions Include:
- identifying least and greatest categories
- reading data on graphs and pictographs with varying scales
- calculating how many more are in one category than another
- calculating the sum of two categories
- determining the total amount of people counted in a survey based on bar graph or pictograph
- correctly labeling the horizontal and/or vertical axis
- identifying corresponding tally chart, pictograph, or bar graph for a given graph
- recognizing true statements about a given graph
- identifying what kinds of questions can be answered based on the data
- recognizing what question was asked in order to collect data
- creating a bar graph or pictograph with given data in a table or in a tally chart
Total Pages
19 pages
Answer Key
Included
Teaching Duration
N/A
Report this resource to TPT
Reported resources will be reviewed by our team. Report this resource to let us know if this resource violates TPT’s content guidelines.
Standards
to see state-specific standards (only available in the US).
CCSS2.MD.D.10
Draw a picture graph and a bar graph (with single-unit scale) to represent a data set with up to four categories. Solve simple put-together, take-apart, and compare problems using information presented in a bar graph.
CCSS3.MD.B.3
Draw a scaled picture graph and a scaled bar graph to represent a data set with several categories. Solve one- and two-step “how many more” and “how many less” problems using information presented in scaled bar graphs. For example, draw a bar graph in which each square in the bar graph might represent 5 pets.


