316 results
Adult education graphing microsofts
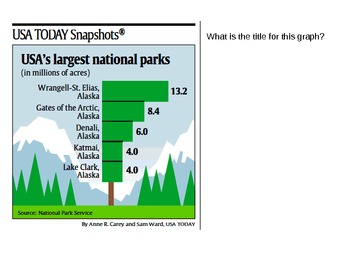
Practice Reading Graphs: USA Today, PowerPoint Version
This PowerPoint presents 10 graphs from the popular "USA Today Snapshots" to provide practice with all aspects of reading graphs - interpreting data, drawing conclusions, recognizing sources, etc. There are 4-5 questions for each graph that challenge students to apply critical thinking skills to the graph data. For each graph, the first question is displayed, then the next slide displays the answer and the next question. This format is perfect for whole group practice. Reinforce this l
Subjects:
Grades:
6th - 9th, Adult Education
Types:
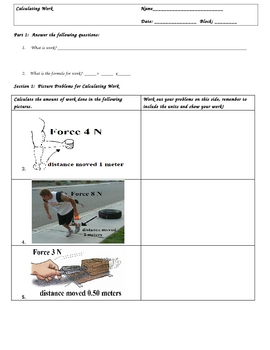
Calculating Work (W=Fxd) Worksheets and Key
Calculating Work (W=Fxd) Worksheets and KeyIf you have been teaching a Simple Machines or Energy Unit, then you need to check out this three page lesson to teach calculating work. It is in three sections.Section 1: Picture QuestionsSection 2: Word Problems/with Challenge QuestionsSection 3: Charting/Graphing ProblemsAll problems are worked out and the key is included.These worksheets include the renown Triangle Method, which has been a proven problem solver for students who struggle in math.The
Subjects:
Grades:
3rd - 12th, Higher Education, Adult Education
3rd Grade Math Jeopardy Game - Measurement and Data 3.MD.4 with Google Slides
Third Grade Common Core Math Jeopardy Game - 3 MD.4 Measurement and Data 3.MD.4 Practice provides two ways for students to practice and show mastery of their Measurement and Data skills. Jeopardy board includes 25 distinct problems and utilizes hyperlinks to award/deduct money from your student teams! (79 slides in all!) Board is automatically updated to show which questions have already been utilized. Also includes an Answer Key if you wish to use questions as Quiz/Test. The PowerPoint file can
Subjects:
Grades:
3rd, Adult Education
CCSS:

Excel Spreadsheets Million Dollars Activity
This resource allows students to understand the following: How graphs change when spreadsheet data is alteredUse of SUM() functionsHow graphs are madeComponents of a graphAdvantages of spreadsheets over pen and paper methodsStudents use this resource to understand how altering data in spreadsheets allow graphs to change. They understand such concepts by trying to spend a Million Dollars in a minute. Students are then expected to complete the associated worksheet which accompanies the spreadsheet
Grades:
5th - 12th, Adult Education
Types:
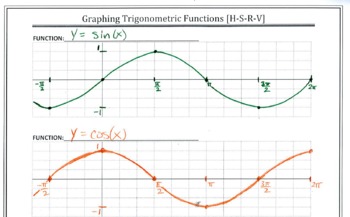
Graph Paper for Trig Functions
This changes everything! Student work becomes more consistent. Your grading will be so much easier! Using the four aligned graphs makes translations of trig functions crystal clear. This file has 2 pages of coordinate planes for graphing trig functions.The first page contains four blank graphs per page. The axes are unlabeled so that students may select their own scale.The second page has five blank graphs per page and is set up for conducting transformations on the coordinate plane.Please see
Subjects:
Grades:
10th - 12th, Higher Education, Adult Education
Interpreting Graphs and Charts
Students work with a variety of 25 graphs and charts and learn how to interpret the information provided. The format varies from one to the other: pie, column bar, horizontal bar, line/dot, and picture (volcano) graphs and table charts. Appropriate for math, Social Studies, ELA, ESL, and Spanish culture. Can be used in Gr. 6-12, adult education, college, and home school. All answer keys provided.
Grades:
6th - 11th, Higher Education, Adult Education
Types:
6th Grade - Coordinate Plane Powerpoint Lesson
6th Grade Coordinate Plane - This is perfect for distance learning on Zoom or similar formats. On top of that it is powerful when used as direct instruction in the classroom. It teaches students how to locate and name points in the coordinate plane in all 4 quadrants. In addition, they learn the terms and concepts of grid, coordinate plane, x axis, y axis, coordinate pair and rules governing the placement of plots. There are 22 effective teaching strategies based on research used in this le
Subjects:
Grades:
6th, Adult Education
Also included in: 6th Grade Powerpoint Mega Math Bundle - 58 Lessons - 2923 Slides
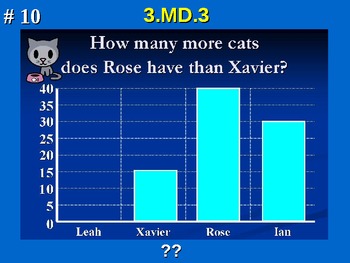
3rd Grade Common Core Math 3.MD.3 Measurement and Data
Third Grade Common Core Math 3 MD.3 Measurement and Data Practice provides two ways for students to practice and show mastery of their measurement skills.
It includes 40 distinct problems in two sets (129 slides in all!), with and without following answer slides. The PowerPoint file can be used on computers, or Promethean and Smart boards.
Take a look at the preview file and buy today for your students benefit!
3.MD.3 Represent and interpret data.
3. Draw a scaled picture graph and a scal
Subjects:
Grades:
3rd, Adult Education
CCSS:
Also included in: 3.MD.3 3rd Grade Math - Draw Scaled Picture & Bar Graph Bundle w/ Google
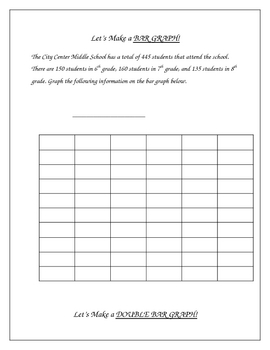
Constructing Graphs - Bar Graphs, Line Graphs, Circle Graphs
**I revised the numbers in the pie graph on this from the first version, these amounts are much more friendly** This activity includes construction of a bar graph, double bar graph, line graph, double line graph, and a circle graph.I put this together after being frustrated about not being able to find any graphing activities appropriate for intermediate grades that would allow me to make graphs with the class on my smartboard. I needed some examples to demonstrate how to take data and create a
Subjects:
Grades:
3rd - 10th, Adult Education
Types:
5.MD.2 5th Grade Math Jeopardy Game - Measurement and Data w/ Google Slides
Fifth Grade Math Jeopardy Game - 5 MD.2 Measurement and Data 5.MD.2 Practice provides two ways for students to practice and show mastery of their ability to represent and interpret data. Jeopardy board includes 25 distinct problems and utilizes hyperlinks to award/deduct money from your student teams! (79 slides in all!) Board is automatically updated to show which questions have already been utilized. Also includes an Answer Key if you wish to use questions as Quiz/Test. The PowerPoint file can
Subjects:
Grades:
5th, Adult Education
CCSS:
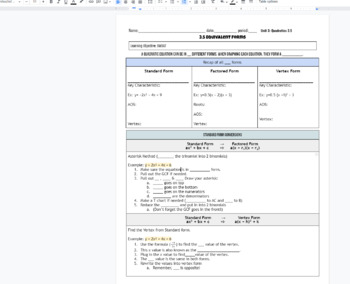
Converting between 3 forms of quadratic equations (equivalent functions) notes
Unit 3: 3.5 Converting between 3 forms of quadratic equations (equivalent functions) notes. In these scaffolded notes / graphic organizers students convert between standard, factored, and vertex form quadratic equations. The notes are broken up to show the steps on how to go from one to another. This also tells how a parabola can look like 3 different equations.Doc is editable. KEY is included in title and at the bottom of the doc. math 2 HS class. (see 3.1, 3.2, 3.3, 3.4 for previous notes!)
Subjects:
Grades:
7th - 12th, Higher Education, Adult Education
CCSS:
Also included in: Quadratic Forms & Characteristics Unit Notes & Homework
6th Grade Statistics & Data 1 - Statistical Questions & Types of Data Lesson
Sixth Grade Statistics 1 - Statistical Questions and Types of Data Powerpoint Lesson is powerful when used as direct instruction in the classroom, online, or individually. It teaches students how to recognize and pose a statistical question. Students also learn the difference between numerical and categorical data. They also learn the 4 basic steps in presenting data: posing a statistical question, gathering the data, displaying the data, and answering the question they posed. There are 22
Subjects:
Grades:
6th, Adult Education
CCSS:
Also included in: 6th Grade Statistics & Data Bundle - 6 Powerpoint Lessons - 402 Slides
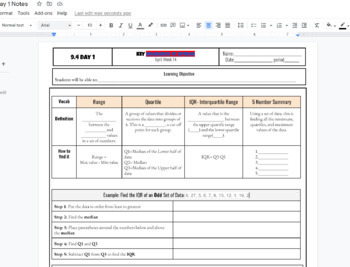
IQR interquartile Range and 5 number summary box and whisker plot Notes
IQR interquartile Range and 5 number summary box and whisker plot Notes including Q1, Q2, Q3, Min and Max and step by step both examples of finding the IQR and creating a box and whisker plot. Used in HS math 1 class WITH KEY INCLUDED AS a link to a printable PDF
Subjects:
Grades:
7th - 12th, Higher Education, Adult Education
CCSS:

Desmos Graphing Project (Review)
This project is meant as a review of linear functions as well as transformations in the coordinate plane (translations, reflections, rotations, dilations). Students get to choose which transformation to perform, so it does not "review all transformations". Students use Desmos to outline a letter, usually an initial, (restricting domain and range) and then transform it within Desmos (in a table). For easier projects: pick transformations for students to perform (translations, dilations) and walk
Grades:
8th - 12th, Higher Education, Adult Education
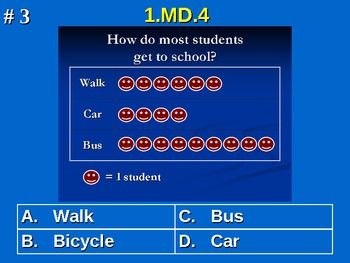
1st Grade Common Core Math 1 MD.4 Interpret Data 1.MD.4
First Grade Common Core Math 1 MD.4 Interpret Data 1.MD.4 Practice provides two ways for students to practice and show mastery of their ability to represent and interpret data.
It includes 40 distinct problems in two sets (129 slides in all!), with and without following answer slides. The PowerPoint file can be used on computers, or Promethean and Smart boards.
Take a look at the preview file and buy today for your students benefit!
Standard 1.MD.4 Represent and interpret data.
4. Organiz
Subjects:
Grades:
1st, Adult Education
CCSS:
Also included in: 1.MD.4 1st Grade Math - Interpret Data Bundle with Google

Parabola Transformations - Interactive
A handy guide to help new students learn how each change affects the shape and direction of parabolas. Clear color coding for the various pieces of the formula and instant updates help separate and isolate the concepts for easy, intuitive learning.Enter information using simple dropdown menus and organized blank fields to isolate each piece of the formula!Two tabs:One allows you to enter individual pieces of information to show the resulting formulaOne allows you to enter the formula to show the
Subjects:
Grades:
7th - 12th, Higher Education, Adult Education
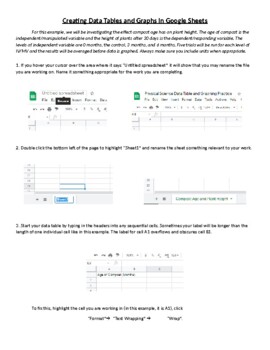
Creating Data Tables and Graphs in Google Sheets
This is an activity that walks students through the process of organizing and entering data into a data table and then using that data to generate line, bar, and pie charts. Once the graphs are generated, the process of formatting and editing the different parts of each graph is explained.
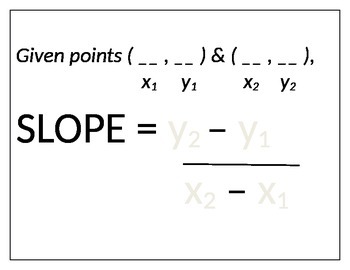
Slope Mats: a hands on "puzzle" manipulative for the slope formula
When students begin using the slope formula, getting the right numbers in the correct locations can be difficult for many. Help your students get a handle on this--literally--with this hands on puzzle approach to filling in values in the slope formula. Great for kinesthetic learners. By Michelle Fries
Grades:
7th - 9th, Adult Education
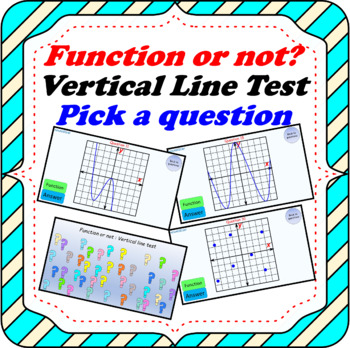
Function or not Vertical Line Test - Powerpoint and print version BUNDLE deal
This is a bundle of the very popular "Vertical Line Test" with 30 questions to help students practice functions and vertical line test. This contains 2 files: a PDF version and a PowerPoint game version.The students must examine each diagram, and decide, by using the straight line test, whether the graph is a function or not.All answers are included.***********************************************************************************************************************************I hope you find
Subjects:
Grades:
10th - 12th, Adult Education
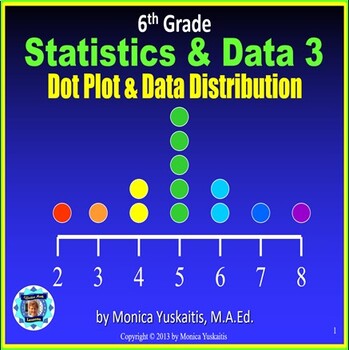
6th Grade Statistics & Data 3 - Dot Plot and Data Distribution Powerpoint Lesson
Sixth Grade Statistics 3 - Dot Plot and Data Distributions Powerpoint Lesson - is powerful when used as direct instruction in the classroom, online, or individually. It teaches students how to read and create dot plots. In addition, students learn to analyze the data as to its center, spread, and most common numbers. There are 22 strategies of effective teaching based on research. For best results, students should have white boards and dry erase markers. For instructions on how to successf
Subjects:
Grades:
6th, Adult Education
CCSS:
Also included in: 6th Grade Statistics & Data Bundle - 6 Powerpoint Lessons - 402 Slides
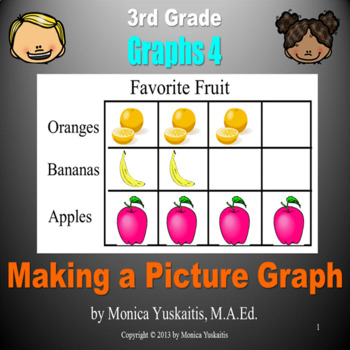
3rd Grade Graphs 4 - Making a Picture Graph Powerpoint Lesson
Third Grade Graphs 4 - Making Picture Graphs - This is perfect for distance learning on Zoom or similar formats. On top of that it is powerful when used as direct instruction in the classroom. It teaches students how to make a picture graph. In addition, the main parts of the picture graph are also taught. The following concepts are reviewed: grid, graph, coordinates, axes, scale, interval, title, and key. There are 22 strategies of effective teaching based on research in this powerpoint les
Subjects:
Grades:
3rd - 4th, Adult Education
CCSS:
Also included in: 3rd Grade Graphs Bundle - 6 Powerpoint Lessons - 277 Slides
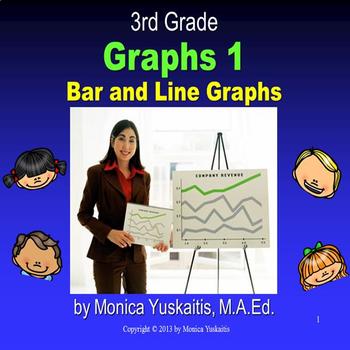
3rd Grade Graphs 1 - Bar & Line Graphs Powerpoint Lesson
Third Grade Graphs 1 - Bar & Line Graphs introduces the students to graphs in general and emphasizes bar and line graphs. This is perfect for distance learning on Zoom or similar formats. On top of that it is powerful when used as direct instruction in the classroom. The following concepts are taught: grid, graph, coordinates, axes, scale, interval, title, key and how to solve problems using a bar or line graph. This lesson is based on 22 principles of effective teaching based on resear
Subjects:
Grades:
3rd - 5th, Adult Education
CCSS:
Also included in: 3rd Grade Graphs Bundle - 6 Powerpoint Lessons - 277 Slides
Histograms and Frequency Tables (Powerpoint) for Busy Teachers
This powerpoint presentation introduces the concept of histograms and frequency tables.
Clipart, sounds, and animation are used sparingly and effectively to help illustrate points without being distracting. This powerpoint presentation has been extensively refined using faculty AND student input and feedback.
Definitions of histogram, interval, frequency table, and frequency are all presented. The progression from a frequency table to a completed histogram is illustrated and animated using
Subjects:
Grades:
4th - 12th, Higher Education, Adult Education
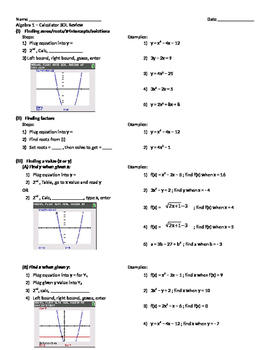
Algebra 1 Calculator Review (TI-84)
Comprehensive review of all graphing calculator concepts taught through the Algebra 1 course. Review concepts include finding roots, factors, values (x or y), y-intercept, mean, standard deviation, line/curve of best fit, and finding solutions to systems of equations. The review include steps and screenshots of the calculator.
Subjects:
Grades:
7th - 12th, Higher Education, Adult Education
Showing 1-24 of 316 results


