86 results
Free 7th grade statistics centers
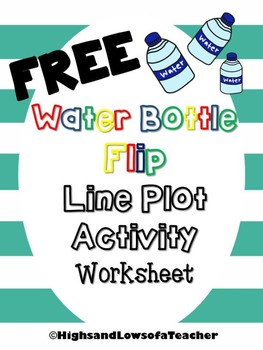
FREE Water Bottle Flip Line Plot Activity
Have your student flip water bottles and see how many times they successfully flip it! Record data and create a line plot!
Check out my other line plot activity here!
Fidget Spinner Line Plot
Subjects:
Grades:
3rd - 8th
Types:
Also included in: Probability Activity BUNDLE
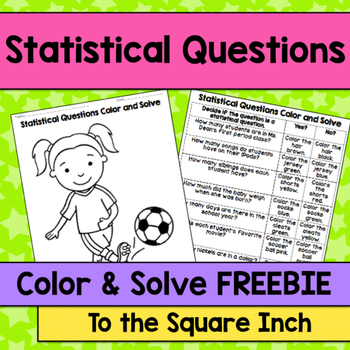
Statistical Questions Color and Solve No Prep Activities, CCS: 6.SP.1 *FREEBIE*
Statistical Questions Color and Solve No Prep Activities, CCS: 6.SP.1 *FREEBIE*
Looking for a fun and engaging, no prep activity to get your students practicing identifying statistical and non-statistical questions?! Check out this color and solve activities! Students will determine whether the given questions are statistical or non-statistical. Once students find their answers, they are directed to color each part of the picture a different color. This activities are self checking!
Check ou
Subjects:
Grades:
5th - 8th
Types:
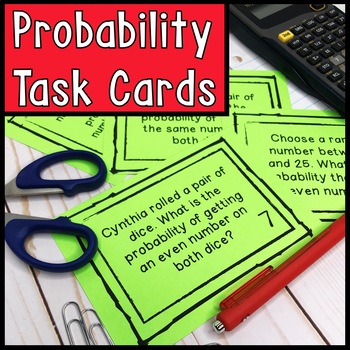
Probability Word Problems Task Cards
Task cards are the multi-functional activity you need for your classroom! Students will practice finding probability. The task cards are aligned to 7th grade TEKS in Texas, but can be used anytime you teach or review probability! How to prep your task cards:•Print•Cut•Laminate•Store in plastic baggies, photo bins, or punch a hole in the corner and keep on a ring! How to use your task cards in your class:•Extra practice for early finishers•“Scoot” game•Stations•Warm-up or Bellringer•Whole class r
Subjects:
Grades:
5th - 8th
Types:
Also included in: 7th Grade Math Task Card Bundle
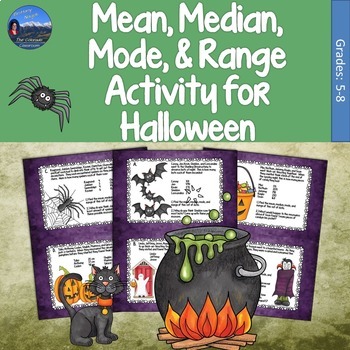
Halloween Math Activity on Mean Median Mode and Range and Central Tendency
This Halloween provide some seasonal fun by practicing the measures of central tendency. Students will compute the mean, median, mode, and range of six different Halloween scenarios. Then using that data, students will think critically to answer other relevant questions. If you like this freebie, you'll love the new digital activity that's twice as large and full of great questions, problem solving opportunities, and extended learning. Check it out here! These cards will have your students..
Subjects:
Grades:
5th - 8th
Types:
Teaching Probability and Risk with SKUNK
Teaching Probability and Risk with SKUNK
SKUNK is a classroom classic – it involves risk, reward, and math that teaches concepts like probability and chance. On top of the intrinsic reward of winning, and the excitement of chance, SKUNK is an incredibly low-prep game that requires no more than paper and dice!
Teaching the Game of SKUNK....
Common Core Standards:
This activity and a lesson plan explaining it meets common core standards for Statistics and Probability. This lesson works best f
Subjects:
Grades:
4th - 9th
Probability Stations
This is a probability station activity I designed for my very active 7th grade math classes. This mostly focuses on independent and dependent events with two game stations thrown in for a brain break. Resources were compiled from other activities available - adapted to fit the needs of my students.
Subjects:
Grades:
6th - 8th
Types:
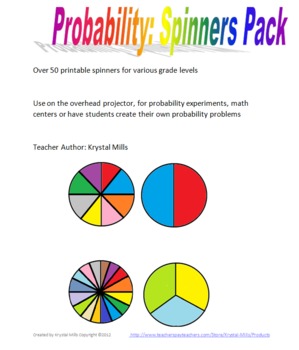
Probability Spinners Pack
This resource includes spinners for probability problems and experiments that could be used in various grades.
Included:
-blank spinners (2,3,4,5,6,8,10 and 16 spaces)
-numbered spinners (2,3,4,5,6,8, and 10 spaces)
-printable sheets (4 spinners to a page) of blank spinners with 2,3,4,5,6,8,10 and 16 spaces
-colored spinners (2,3,4,5,6,8,10 and 16 spaces)
Over 50 spinners that can be used with various grades and for various activities. Ready to print and go!
Teacher Author: Krystal Mills
pr
Subjects:
Grades:
3rd - 8th
Types:
Scatter Plots | Google Forms Activity
★ DIGITAL Math Resource★ Are you looking for quality, standards aligned math resources to use with Google Classroom™? This resource is a fun and engaging way for students for practice solving problems involving scatter plots. This product includes a Google Form with 20 questions about scatter plots. Problems cover correlation type, the line of best fit and predicting scatter plot values. Possible Uses:• Practice• Homework • Assessment• ReteachCheck out my other products HERE.Please review my ter
Subjects:
Grades:
7th - 12th
Types:
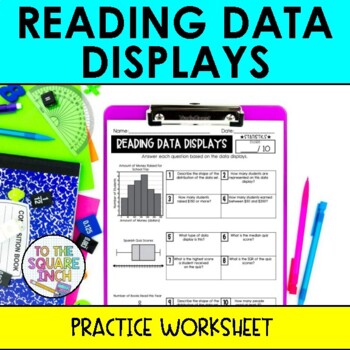
Reading Data Displays Worksheet
Reading Histograms, Box and Whisker Plots and Line Plots FREE math practice worksheet. Check my other Statistics activities HERE
Subjects:
Grades:
6th - 8th
Types:
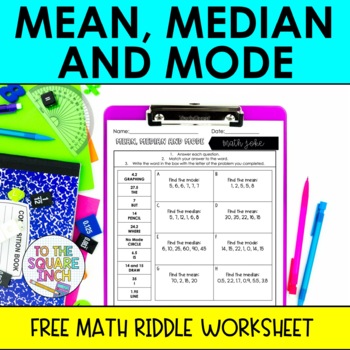
Mean Median and Mode Worksheet
Mean, median and mode FREE math riddle activity Check my other Mean, Median and Mode activities HERE
Subjects:
Grades:
6th - 8th
Types:
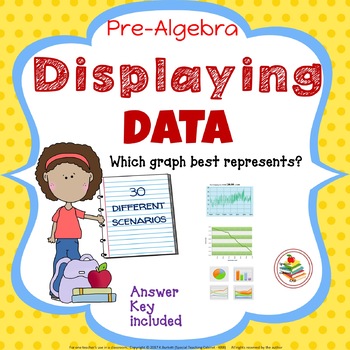
Displaying Data Math Graph Matching Activity
Displaying Data Math Graph Matching Cooperative Activity
Match 30 different scenarios to 6 types of graphs: circle graph, line graph, line plot, histogram, bar graph, scatter plot. Answer Key included!
Other teaching options:
Cooperative learning activity to reinforce previous learned taught material. Give students sets of task cards to answer with their group.
Small groups, present few scenarios at a time. When groups are finished, discuss given scenarios as a whole group before moving onto
Subjects:
Grades:
6th - 8th
Types:
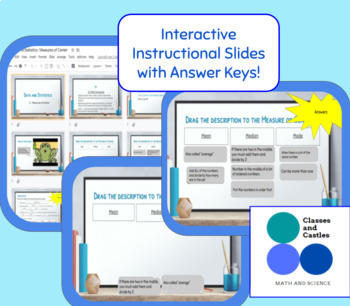
Statistical and Non-Statistical Questions Interactive Google Slides FREE!
This lesson is part of a course that can be purchased here: Data and Statistics Course (Google Classroom- Post and Go) DISTANCE LEARNINGIn this lesson students will:Receive direct instructionTake guided notesDrag and drop answers into the correct categoryCheck off which questions are statisticalSummarize statistical questionsIdeal for:6th-grade academic levelLearners who have a reliable device and internet connectionStudents should have a device with a screen size of at least 9 inchesGoogle Clas
Subjects:
Grades:
5th - 8th
Types:
CCSS:
6th Grade Math Probability Exit Tickets
These 6th grade math bell ringers include 4 exit slip math problems for each of the following 6 topics related to probability (24 total problems). The problems on the exit tickets increase in difficulty and are meant for use as an exit slip to check for student understanding. An answer key and teacher guide IS included!You can get this resource and many of my other upper elementary/middle school resources at a discount as a part of the following mega bundle!Math Mega Bundle (For Upper Elementary
Subjects:
Grades:
4th - 7th
Types:
Also included in: 6th Grade Math Exit Tickets Bundle | Exit Slip or Bell Ringer Activities
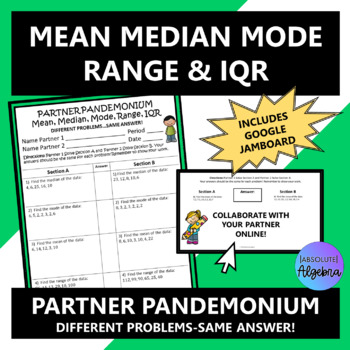
FREE Mean Median Mode Range IQR PDF and Google Jamboard Partner Pandemonium
Mean Median Mode Range IQR PDF and Google Jamboard Partner Pandemonium FREEBIEHold all students accountable and engaged with this fun mean, median, mode, range, and IQR (Interquartile Range) partner activity. It can be printed on a PDF or you can use Google Jamboard for an online version. Partner A solves one side of the worksheet. Partner B solves the other side. The answers for each problem are the same even though the problems are diff
Subjects:
Grades:
6th - 7th
Types:
Also included in: Partner Pandemonium Middle School Bundle PDF and Google Jamboard
Centimeter & 1 Inch Grid Papers (Full Sheets Each)
A full sheet of Centimeter Grid Paper and a full sheet of 1 inch Grid Paper all contained in one easy to transport/store .pdf. You can use these sheets with making charts, plotting points, etc... Enjoy and thank you for your support.
Subjects:
Grades:
PreK - 12th, Higher Education, Adult Education, Staff
Types:
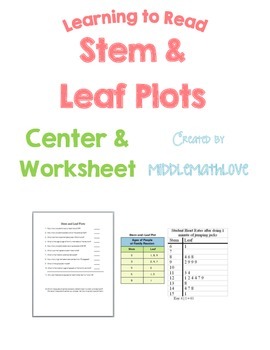
Data Analysis Worksheet - Reading & Analyzing Stem and Leaf Plots
This product is perfect for an introductory or review lesson on understanding how to read stem and leaf plots. Post the data displays on the SmartBoard or print out copies for each student. Students answer questions on the worksheet by reading and analyzing the graphs.
Stem and Leaf Plot Activity Includes:
--1 Stem and Leaf Plot Student Worksheet
--2 slides of Stem and Leaf Plots
I combined this product with my other data analysis worksheets (box and whisker plots and histograms) to create
Subjects:
Grades:
7th - 10th
Types:
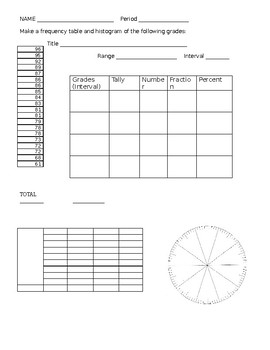
Intro to Frequency Tables - Histogram
This is a student friendly worksheets for students to learn how to collect data and make a frequency table and Histogram and circle graph. First page, set of grades are used as data, then students can fill in the frequency table.
Subjects:
Grades:
5th - 7th
Types:
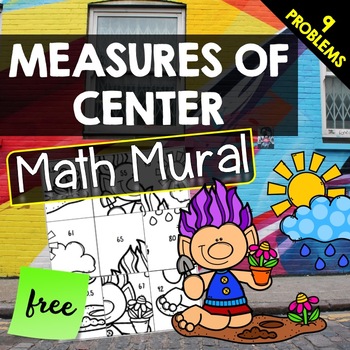
Measures of Center - Math Mural (FREEBIE)
Measures of Center - Math MuralAligned with Texas TEKS 6.12(C)In this activity, students solve 9 problems to practice finding the mean, median, mode and range and get their work approved by the teacher. Then they cut out mural pieces and match their answers to the problem numbers to create their Math Mural picture!This product includes:Page 1- Title PagePage 2- 9 Measures of Center Problems with Work SpacePage 3- Math Mural CanvasPage 4- Math Mural PicturePage 5- Answer KeyWorks great as:- Cente
Subjects:
Grades:
6th - 9th
Types:
CCSS:
Grand Slam Math: Using Baseball to Reinforce Math Skills (Common Core)
Baseball has been in America since the 18th century, and is full of math!!!!! This product allows students to examine three different ways that math is embedded into baseball, including home runs, stolen bases, and wins. Each of the three categories contains five questions (addition, subtraction, multiplication, division, and graph/writing/higher level thinking question). This is a resource that could be used to enrich a math curriculum, in a math center, or in a small group or teamwork setting
Grades:
5th - 7th
Types:
Probability of chance events using number lines fractions percents
Get students started in probability by helping them understand that probability of chance events can be expressed in terms such as impossible, unlikely, equally likely, likely and certain. CCSS 7.SP.5 - They'll learn that probability can also be described by a number from zero to one. Included are two/ activities/worksheets to help you start your students in their first formal introduction to probablity.
Please rate my work and provide feedback!
Terri Feil
Subjects:
Grades:
5th - 9th
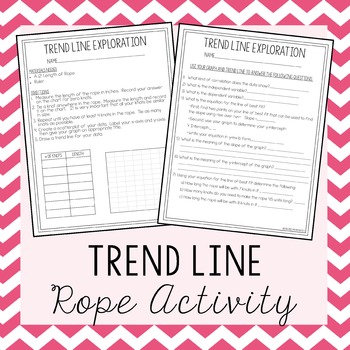
Trend Line Activity ~ Knots in a Rope
***This activity requires each student to have a 12" length of rope and a ruler***
Students collect data by tying knots in a rope and recording the length of the rope after each knot. Students then use this data to do the following:
~Create a Scatterplot
~Draw a Trend Line
~Write an equation in slope-intercept form for the trend line
~Use the equation of their trend line to make predictions
o Click Here for more Functions & Linear Equations activities
o Click Here for more 8th Grade Math
Subjects:
Grades:
6th - 9th
Types:
Also included in: 8th Grade Math Bundle ~ All My 8th Grade Math Products at 1 Low Price
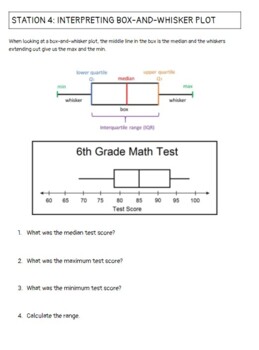
Applied Statistics End of Year Review Stations
A set of 10 stations to help students practice interpreting bar graphs, stem-and-leaf plots, and box-and-whisker plots. Also, works with finding the mean, median, mode, and range. Finally, have probability and normal distribution questions.
Subjects:
Grades:
7th - 12th
Types:
CCSS:
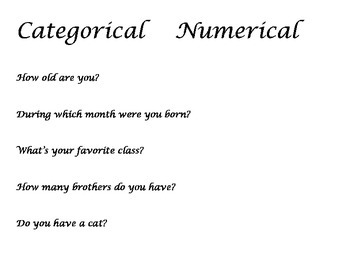
Data Question Types Sort: Categorical or Numerical
(Almost) no prep sorting activity for students to practice identifying if a statistical question is referring to numerical or categorical data. Simply print, copy, cut, and set out. Could be used as a stations-type activity, a formative assessment, partner work, cooperative group work, or a springboard for a discussion on data types.
Subjects:
Grades:
5th - 7th
Types:
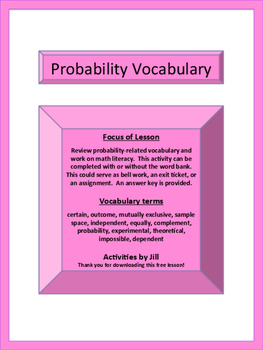
Probability Terms Worksheet with Word Bank (Distance Learning)
Focus of LessonReview probability-related vocabulary and work on math literacy. This activity can be completed with or without the word bank. This could serve as bell work, an exit ticket, a math center, or an assignment.Vocabulary termscertain, outcome, mutually exclusive, sample space, independent, equally, complement, probability, experimental, theoretical, impossible, dependentUse this note-taking product to introduce the vocabulary terms!Probability Vocabulary NotesCCSS 7.SPProbability Te
Subjects:
Grades:
6th - 9th
Types:
Showing 1-24 of 86 results


