147 results
7th grade graphing simulations by TpT sellers for TpT sellers
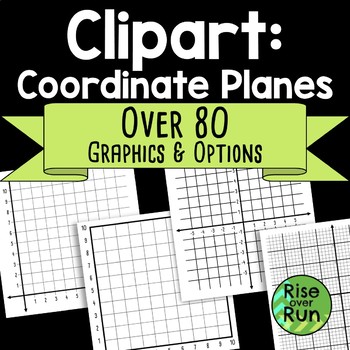
Coordinate Planes Graphs Clipart
Graphing clip art for math teachers and all kinds of math applications! Images include 1st quadrant graphs, all 4 quadrant graphs, 2 quadrant graphs, graphs with and without numbers, graphs with and without x and y axis labels. High quality jpg and png files are included. JPGs have white backgrounds, and PNGs have transparent backgrounds. All images are over 1000 pixels in each dimension. (They can be printed very large and will hold quality.) These are great for creating your own graphing acti
Subjects:
Grades:
5th - 12th

Line of Best Fit and Scatterplots
Who doesn't love a good mystery?!!!! In this engaging students use a real life scenario to apply scatterplot data of shoe size and height and the line of best fit to capture the correct suspect. This product has lots of great reviews! Many middle school math teachers state this was a great way to review the concept of line of best fit and scatterplots. Aligned to CCSSM8.SP.A.2 and CCSSM8.SP.A.3This activity is also available in a bundle at a discounted rate:Scatterplots and Line of Best
Subjects:
Grades:
7th - 9th
Types:
Also included in: Line of Best Fit and Scatterplots: The Bundle
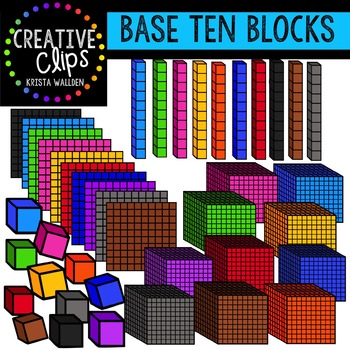
Base Ten Blocks {Creative Clips Digital Clipart}
This HUGE 88-image set is a must-have for creating your math resources! Included are 81 vibrant, colored images and 7 black and white versions. These base ten blocks come in all 12 of my signature Creative Clips colors and are perfect for incorporating into any seasonal math resource with so many color choices!
This set includes 2D versions of ones, tens, and hundreds in 12 different colors, as well as 3D versions of ones, tens, hundreds and thousands blocks in 12 colors.
The images will have
Subjects:
Grades:
PreK - 12th, Staff
Line of Best Fit and Scatterplots: The Bundle
This bundle includes 2 engaging activities where students can apply the skills of plotting points in a scatterplot, making a line of best fit, and finding the slope of the line to find missing data. Fun scenarios of Sasquatch and a crime scene hook kids into learning. Please leave feedback, you can earn TpT credits for future purchases. If you enjoy these activities consider following my store as I work to increase my middle school math inventory. Check out my other middle school math produc
Subjects:
Grades:
7th - 9th
Types:
Math {Creative Clips Digital Clipart}
This HUGE 74-image set is a must-have for creating your math resources! Included are 52 vibrant, colored images and 22 black and white versions.
Looking for other school subject clipart? Check out my bundle of sets for math, science, social studies, reading and writing at a discount!
SCHOOL SUBJECT BUNDLE
The images will have high resolution, so you can enlarge them and they will still be crisp.
All images are in png formats so they can easily be layered in your projects and lesson material
Subjects:
Grades:
PreK - 12th, Staff
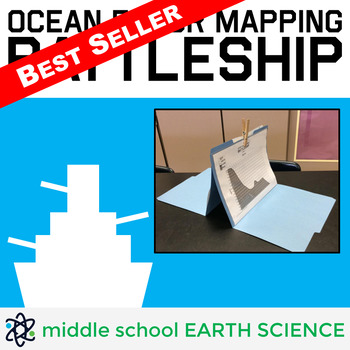
Ocean Floor Mapping Battleship Game
Teacher Review: "My students are obsessed with this activity! They even ask to play during indoor recess!" - Turner's Teaching Troop (January 22, 2020)Ocean Floor Mapping Battleship includes 36 unique maps of the ocean floor, a recording sheet, a detailed lesson plan with suggested pre-game activities, a blank map students can use to draw their own ocean floor, a diagram showing the layers of the ocean, and easy to follow game instructions. Field tested with sixth-graders, this game challenges s
Subjects:
Grades:
5th - 9th
Types:
CCSS:
Also included in: Earth Science Games Bundle
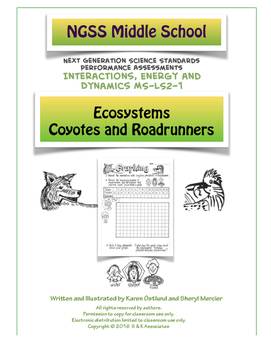
Ecosystems- Roadrunners and Coyotes NGSS Middle School LS2-1
Turn your students into an active ecosystem. This activity is similar to the classic Oh Deer simulation with a roadrunner and coyote twist. This sequence of NGSS aligned activities/assessments includes two simulation activities in which students are in the roles of a population of roadrunners, a predator (coyote), and resources (food, water, shelter). Students collect, graph, and analyze data to look for cause and effect relationships in an ecosystem. Reading and writing pages are included along
Subjects:
Grades:
5th - 7th
Types:
NGSS:
MS-LS2-1
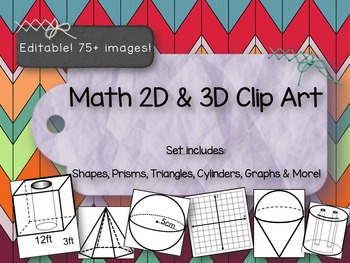
Clip Art Shapes -2D & 3D Prisms, Graphs, Cylinders and more! PPT File
One of the teachers at my school was having trouble finding some 3D geometric shapes to make her test with, so I made a few for her. Then one thing led to another, and now I have a whole bunch of clip art that I thought a Math teacher might find useful. I have used these images to create tests, task cards, scavenger hunts, and practice work for Math small group and centers.
This file is not meant to be used as a presentation. The idea is that you can copy/paste whatever you need from here a
Subjects:
Grades:
5th - 10th
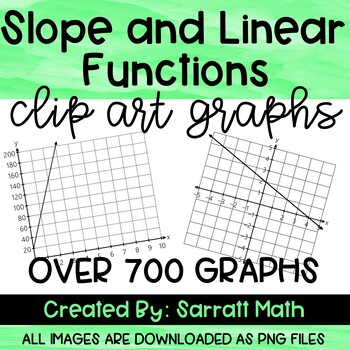
Slope and Linear Functions Clip Art Graphs - Math Clip Art
Looking for algebra 1 clip art images to make resources for your classroom? This linear function clip art graph set contains over 700 png files that include:Graphs with positive and negative slopesGraphs with zero and undefined slopes (horizontal and vertical lines)2 Blank graphs (5x5 and 10x10)Various graph sizes: 5x5 grid and 10x10 grid (x and y both increase by 1 unit)x increase by 1 and y increase by 2x increase by 1 and y increase by 3x increases by 2 and y increases by 2x increases by 1 an
Subjects:
Grades:
7th - 12th, Higher Education
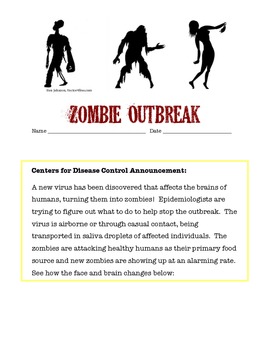
Investigating the Spread of a Viral Outbreak
Students in grades 5 - 9 model the spread of an infectious disease under the entertaining theme of a zombie outbreak. One student unknowingly is patient zero and students simulate the spread of an airborne illness. This highly engaging activity covers health topics, nature of science, and math skills as students graph data in a line plot. Higher level students can be challenged to find the function of the exponential growth of the outbreak.
Subjects:
Grades:
6th - 9th

Stock Market Simulation Challenge I Digital Learning
What better way to understand how the stock market works than to simulate it in your classroom? To make it a competitive project! This simulation contains the project worksheets, hyperlinks, research guides, and graphs needed for your students to "purchase" their own stock and track it's value over time. This project was written to accompany Gary Paulsen's book "Lawn Boy," but it can be used with or without this book.These activities are suitable for upper-elementary and middle grade students
Subjects:
Grades:
5th - 7th
Types:
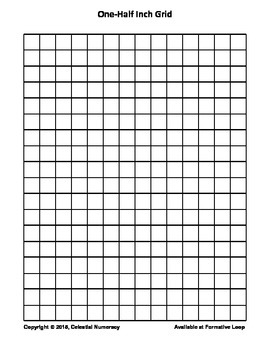
1/2 Inch by 1/2 Inch Grid Paper (FREE)
This resource is great for use in teaching many GT activities where a grid is needed for scaling or teaching area in modeling or independent student work. It may also be used for Cartesian Coordinate Graphing in middle school. We always laminate these resources, so we can use them over and over and with vis-à-vis markers during direct teach.
Subjects:
Grades:
2nd - 8th
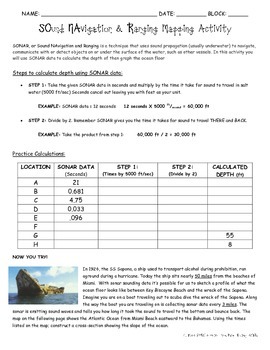
SONAR Calculations and Graphing
In this classroom activity, students are guided through the calculations necessary to obtain ocean depth from SONAR data. Then they use data to complete a profile of the part of ocean floor from which the data came. Please note: this does not show all the parts of the ocean floor. Image and activity where adapted from Naval History STEM H.
Subjects:
Grades:
6th - 12th
Types:
Scatterplots and Line of Best Fit
This engaging activity allows students to apply their knowledge of slope, scatterplot data, and line of best fit to figure out how tall Sasquatch is. Taking the role of engineers, students use a foot print of sasquatch to approximate his height which is needed to construct a trap. An engaging newspaper article sets the scene of the recent Sasquatch sightings at the local park. This activity is also available in a bundle at a discounted rate:Scatterplots and Line of Best Fit BundleAligned to C
Subjects:
Grades:
7th - 9th
Types:
Also included in: Line of Best Fit and Scatterplots: The Bundle
8.4B Unit Rate, Graph Proportional Relationships (Mirrored Questions)
8.4B Unit Rate, Graph Proportional RelationshipsThis includes 12 Graph Problems that students are able to easily understand.Get students to learn how to identify the unit rate of a graph that models the relationship. Graph problems vary in degree of difficulty and allows students to understand mirrored questions from state assessments.Also includes:- Ratio problems- Graphs- AnswersCan also be used as worksheet for classwork, homework, quizzes or test preparation.Easy to understand and Easy to g
Subjects:
Grades:
7th - 9th
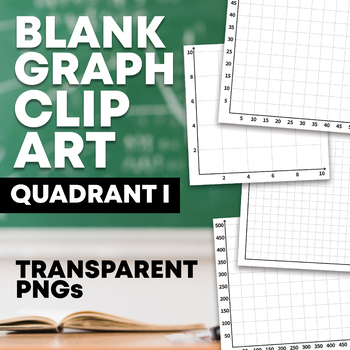
Graphing Clip Art: Quadrant I Blank Graphs
Stop searching online for mismatched blank graphs for your worksheets! This set of 36 transparent PNGs are perfect for teachers or TPT sellers looking to make cohesive, customized worksheets, flash cards, or other educational products using Quadrant I of the coordinate plane. Graphs include:5x5 grid, from 0-5 to 0-500 and blank10x10 grid, from 0-10 to 0-500 and blank16x16 grid, from 0-16 to 0-1600 and blankClick "View Preview" to view the Terms of Use and a preview of the product before purchasi
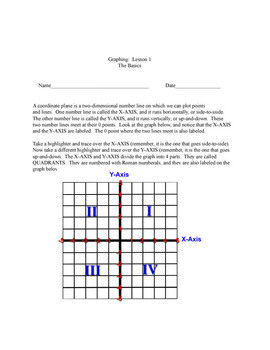
Graphing Booklet #1: The Basics of the Coordinate Plane
I created this booklet for use in my classroom. I have also used it to help students I tutor. I teach geometry, and I noticed that I had a few students who still could not plot points correctly. I made this booklet, which includes step-by-step lessons and activities on the basics of the coordinate plane (the x and y-axis, the origin, the quadrants, ordered pairs, plotting points), and it has helped the students tremendously. When I shared this booklet with other teachers, they requested copi
Grades:
4th - 9th
Coordinate Planes Graphs, Grids, Clip Art, Template
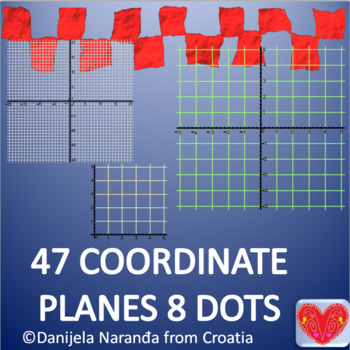
56 png images, high quality, on transparent background47 images of coordinate planes with grids (templates) I,II, III and IV quadrant 20x20 by 1, 10 x10 by 1, 10 x 10 by 0.5, 20 x 20 by 5, 5x5 by 0.25I quadrant 5x5 by 1, 5x5 by 0.5, 10x10 by 18 dots for coordinate planes, different color
Subjects:
Grades:
5th - 12th, Higher Education
Graphing Booklet #2: Slope Formula and the Rise over Run Method
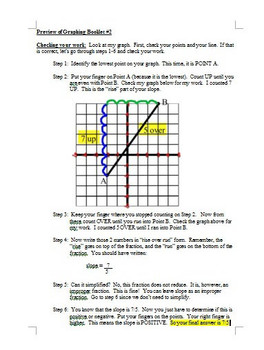
This is my follow-up to my first graphing booklet. In this booklet, students will first determine whether the slope of a line is positive, negative, zero, or undefined by looking at a graphed line. This lesson is crucial in future success of determing the exact slope of a line. In lesson 2, students will learn the "rise over run" method of determining slope of a graphed line. I teach this differently than many people, and I explain a very simple (tactile) method of determing whether a slope
Grades:
5th - 10th
Projectile Motion Simulation Lab- PhET
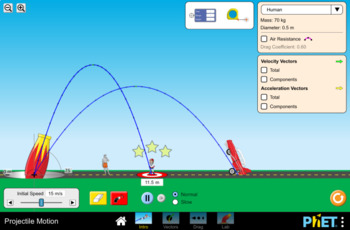
This handout is meant to accompany the Projectile Motion simulation found here: https://phet.colorado.edu/en/simulation/projectile-motion
45 minute lesson time
This lab can be used to teach a range of concepts such as:
-Relationships between independent/manipulated and dependent/responding variables
-Forces in motion
-Projectile Motion
-The relationship between firing angle and distance traveled
-Graphing independent/ dependent variables
-Creating data tables
Subjects:
Grades:
6th - 12th, Higher Education, Adult Education
Types:

Coloring Pages for Adults Boho Landscape
About Boho Landscape Coloring Pages for Adults Graphic&&&&&&&&&&&&&&&&&&&&&&&&&&&&&&&&&&&&– WHAT YOU WILL GET?•184 INTERIOR PNG(300 DPI,1920*2528 px)•30 COVER PAGE (300 DPI,1920*2528 px)&&&&&&&&&&&&&&&&&&&&&&&&&&&&&&&&&&
Subjects:
Grades:
PreK - 12th, Higher Education, Adult Education
INVESTING IN THE STOCK MARKET : an in-class simulation guide
This is a 29 page package to support teachers in running a 24 day stock market simulation in their grade 5-10 classroom. I have used a version of this in my class for several years now and the kids LOVE it! I have adjusted it and perfected it to include a 24 page student booklet, an evaluation sheet, and a three page SPECIFIC teacher instruction manual.
I offer this exact resource IN FRENCH. Check out La classe de Mme Geneviève for other Math Resources and French Immersion Resources.
Thank
Subjects:
Grades:
5th - 10th
Types:
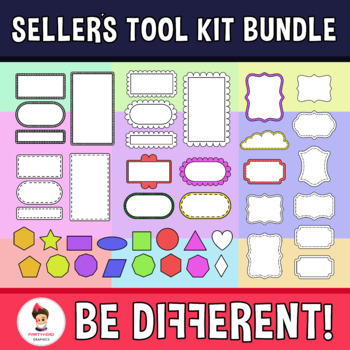
Seller's Tool kit Bundle - Frames, Shapes, Backgrounds, M. Exerc....
Enjoy! This set includes the following images on 300dpi.Here are the details:- Frames.- Backgrounds.- Differents shapes.- Covers.- Excercise pages.- Different colors for all.- Blackline version.Email: adolfo-1985@hotmail.comEnjoy and be happy :).TERMS OF USE: This resource is for limited educational and commercial use. Please make sure the images are flattened and/or protected. You can use it to create your own products as long as there is educational content included. This product can be used t
Grades:
PreK - 12th, Higher Education, Adult Education, Staff
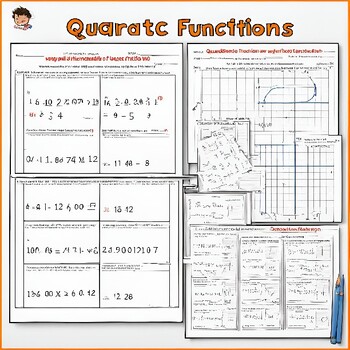
Quadratic Functions Worksheets Algebra 1
**Quadratic Functions Worksheets: Engaging and Comprehensive Practice for Students**Unlock the power of quadratic functions with our meticulously designed Quadratic Functions Worksheets, perfect for middle and high school math students. These worksheets provide a comprehensive and engaging way for students to master the core concepts and applications of quadratic functions, from basic to advanced levels.**What's Inside:**1. **Introduction to Quadratic Functions:** - Understanding the standard
Grades:
5th - 12th
Showing 1-24 of 147 results


