Graphing Clip Art: Quadrant I Blank Graphs
Creative Access
1.5k Followers
Resource Type
Standards
CCSS5.G.A.1
CCSS5.G.A.2
CCSS6.G.A.3
CCSS7.EE.B.4b
CCSS8.EE.B.5
Formats Included
- Zip
Creative Access
1.5k Followers
Description
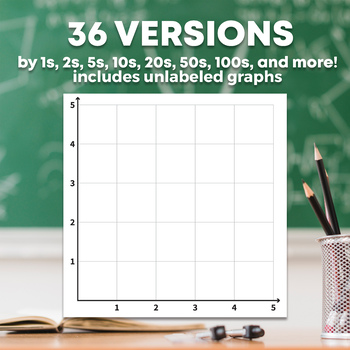
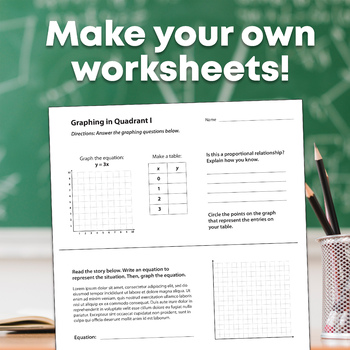
Stop searching online for mismatched blank graphs for your worksheets! This set of 36 transparent PNGs are perfect for teachers or TPT sellers looking to make cohesive, customized worksheets, flash cards, or other educational products using Quadrant I of the coordinate plane.
Graphs include:
- 5x5 grid, from 0-5 to 0-500 and blank
- 10x10 grid, from 0-10 to 0-500 and blank
- 16x16 grid, from 0-16 to 0-1600 and blank
Click "View Preview" to view the Terms of Use and a preview of the product before purchasing.
TPT Sellers:
Please read the Terms of Use carefully before purchasing.
You may also like:
Total Pages
Answer Key
N/A
Teaching Duration
N/A
Report this resource to TPT
Reported resources will be reviewed by our team. Report this resource to let us know if this resource violates TPT’s content guidelines.
Standards
to see state-specific standards (only available in the US).
CCSS5.G.A.1
Use a pair of perpendicular number lines, called axes, to define a coordinate system, with the intersection of the lines (the origin) arranged to coincide with the 0 on each line and a given point in the plane located by using an ordered pair of numbers, called its coordinates. Understand that the first number indicates how far to travel from the origin in the direction of one axis, and the second number indicates how far to travel in the direction of the second axis, with the convention that the names of the two axes and the coordinates correspond (e.g., 𝘹-axis and 𝘹-coordinate, 𝘺-axis and 𝘺-coordinate).
CCSS5.G.A.2
Represent real world and mathematical problems by graphing points in the first quadrant of the coordinate plane, and interpret coordinate values of points in the context of the situation.
CCSS6.G.A.3
Draw polygons in the coordinate plane given coordinates for the vertices; use coordinates to find the length of a side joining points with the same first coordinate or the same second coordinate. Apply these techniques in the context of solving real-world and mathematical problems.
CCSS7.EE.B.4b
Solve word problems leading to inequalities of the form 𝘱𝘹 + 𝘲 > 𝘳 or 𝘱𝘹 + 𝘲 < 𝘳, where 𝘱, 𝘲, and 𝘳 are specific rational numbers. Graph the solution set of the inequality and interpret it in the context of the problem. For example: As a salesperson, you are paid $50 per week plus $3 per sale. This week you want your pay to be at least $100. Write an inequality for the number of sales you need to make, and describe the solutions.
CCSS8.EE.B.5
Graph proportional relationships, interpreting the unit rate as the slope of the graph. Compare two different proportional relationships represented in different ways. For example, compare a distance-time graph to a distance-time equation to determine which of two moving objects has greater speed.


