6 results
Free 3rd grade graphing teacher manuals
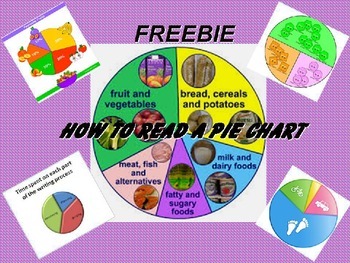
How to Read a Pie Chart: Grades 2 to ...
Teach your students to read and interpret pie chart. This teacher guide may be used for students as early as grade 2. Challenge your students to think more critically and become better mathematicians.
Download this guide and start your students on their way to becoming better problem graphic interpreters. FREE.
Some additional activities you may wish to check out: (Just click on the link provided)
Learning to read graphs. Freebie
Learning to Read Graphs
Reading a line graph.
Rea
Subjects:
Grades:
2nd - 12th, Adult Education
Types:
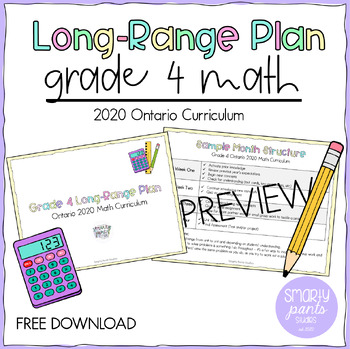
Grade 4 Math - Long Range Plan with Links - Ontario 2020 Curriculum
Teaching a new grade and having trouble deciding how to structure your year in math? This FREE Grade 4 Long-Range Math Plan provides you a guide as well as links to resources you can use to plan for math all year long. All resources were creating using the 2020 Ontario Math Curriculum.What's included:- Sample Weekly Lesson Structure- Sample Month Timeline- Month-By-Month Glance - topics and links to resources providedSimilar Resources You May Be Interested In:Grade 4 Math - Operations Unit and W
Subjects:
Grades:
3rd - 5th
I Surveyed My Classmates With Excel and Power Point Integration
This lesson integrates technology into mathematics, writing, and technology standards with easy to follow, step-by-step instruction and worksheets for students. Students conduct surveys and display their survey results using Excel and Power Point. The students Power Points can be combined to make one Power Point presentations which students can use to present their survey results. Excel is a very easy tool to use for making professional graphs. Instructions for Excel 2007 and 2010.
Grades:
2nd - 3rd

Common Core Standards for Measurement and Data for K-5
The Common Core Standards for Measurement and Data for K-5 are listed.
Subjects:
Grades:
K - 5th
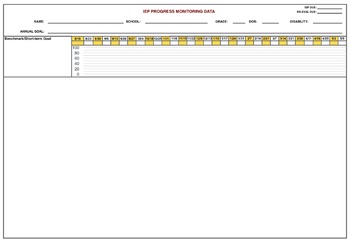
IEP/Goal Monitoring for iPad with Automatic Graph*SAMPLE*
Monitor any goal or behavior with this convenient and paper free monitoring from that automatically graphs each goal right on your iPad.
This FREE SAMPLE will allow only one goal.
NOTES:
*This file is in a ZIP format and will need to be unzipped before it can be used (can be unzipped on your iPad with iZip free).
*This document is for use with the Apple, Numbers app (well worth the investment!).
*It is compatible for iPad, iPhone, iPod Touch and iPod Mini devices.
Subjects:
Grades:
PreK - 12th, Higher Education, Adult Education, Staff
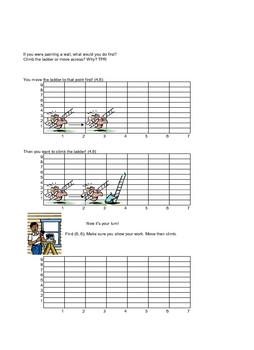
Grid Graph tip
This technique of teaching how to plot a coordinate on a grid has helped my students a lot.
Grades:
2nd - 5th
Showing 1-6 of 6 results


