21 results
Free 3rd grade graphing homeschool curricula
Lesson Plan: Out of the Furnace (Math/Science)
Take a walking field trip to find a good place to cool off.This lesson combines math (Basic operations and graphing), science (temperature and data collection)and the Fiery Furnace from Daniel 3. Extensions to the lesson bring in vocabulary and journaling. This lesson has adaptations to use with a mixed grade level class/differentiated learning. A .PDF and 3 JPEGs are included in the ZIP file.Check out additional products: Noah addition + subtraction Free math lesson planNoah reader's theater F
Grades:
K - 3rd
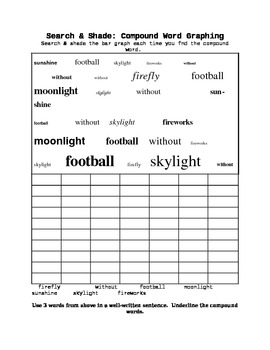
Search & Shade: Compound Words
Today's student needs an integrated approach to learning. By combining a bar graph activity with a language arts review of compound words, students realize that everything eventually can and will overlap. This activity is just one more way keep what some kids find boring- creative and exciting.
This activity works well as a classwork reinforcement, a paired activity, or as whole group guided work, displayed on the board via transparency or document camera.
Subjects:
Grades:
3rd - 5th
Spring Theme: Creating a Bar Graph FREEBIE
Spring Themed Bar Graph Activity FREEBIE (2. MD. 10) Easy to use graphing activity! Using and interpreting data is fun with quick and easy to use graphing activities. Included in this product: Creating a Bar Graph (Color Coded for printing in black/white)Creating a Bar Graph-printable in colorCreating a Bar Graph-Answer Key (Color Coded for printing in black/white)Creating a Bar Graph-Answer Key-printable in colorSuggested Use for: Good Morning WorkMath CentersPartner WorkMust Do/May DoGuided Pr
Subjects:
Grades:
1st - 4th
Great Grid! Practice Ordered Pairs
If you're looking for an interactive way to practice ordered pairs (coordinate graphing), "Great Grid!" from Mrs. Killen's Kids is perfect for you!
Great Grid can be used as an introduction or brief review of ordered pairs with questions formatted in two ways. Kids choose a picture for a given ordered pair or choose the ordered pair for given picture.
I've used this resource whole group while kids write answers on whiteboards and have also loaded it on classroom computers for kids to practice
Grades:
2nd - 3rd
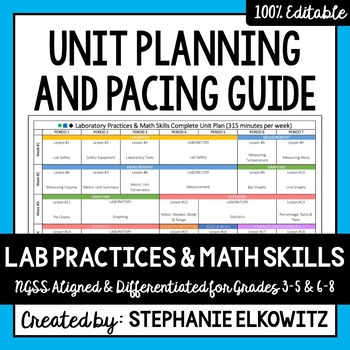
Lab Practices and Math Skills Mini Unit Planning Guide
A FREE and EDITABLE resource to help you design an introduction to laboratory practices and math skills Mini Unit. It includes multiple pacing options to focus or broaden the scope of your course and to meet the needs of your students. The guide aligns lessons with grades 3-5 and/or middle school NGSS Science and Engineering Practices.About this Product:• Includes a summary of topics, LOs and appropriate resources required for each lesson• Includes individual unit planning guide with differenti
Subjects:
Grades:
3rd - 8th
Graphing Worksheet
FREE - Graphing Worksheet Template.One free blank graphing worksheet template for your lessons.As part of the the mighty $8 Math Bundle for upper elementary.More from the store...Weekly Magazine packages:Grades K-6 -- $14.99 (100 issues, 1100 pages)Grades K-2 -- $7.99 (50 issues, 550 pages) Grades 3-6 -- $7.99 (50 issues, 550 pages)Grades K-1 -- $6.99 (25 issues, 275 pages) Grades 1-2 -- $6.99 (25 issues, 275 pages)Grades 3-4 -- $6.99 (25 issues, 275 pages)Grades 5-6 -- $6.99 (25 is
Subjects:
Grades:
1st - 8th
Also included in: Art Bundle
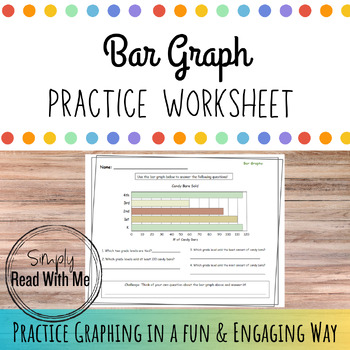
Bar Graph Practice Worksheet
Help your learners master bar graphs with this engaging review worksheet about 'Candy Bars Sold.' Learners answer questions based on this scaled bar graph to solidify thier knowledge. Learners are able to challenge themselves by thinking of and answering thier own question about the bar graph. This resource is perfect for small groups, homework, sub plans, review, and homeschool curriculum practice!⭐️DOWNLOAD THE PREVIEW FILE TO SEE THIS RESOURCE IN MORE DETAIL⭐️YOU MAY ALSO ENJOY:→ Graphing Je
Subjects:
Grades:
1st - 3rd
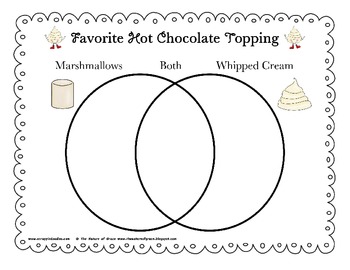
FREE Venn Diagram - Hot Chocolate Toppers (Christmas, Winter, Valentine's Day)
This is a simple, fun Venn diagram created to go along with my Hot Chocolate Mini Activity Pack (coming soon!). Great for homeschooling or a classroom (see ideas for both below).
- Place in a winter related center and let kids write their names inside when they arrive at that center. Discuss the graph at the end of the week.
- Complete as a small group fun activity.
- Send home for homework and then meet to discuss AND bar graph the results of the entire class.
- Interview family and friends
Subjects:
Grades:
K - 3rd
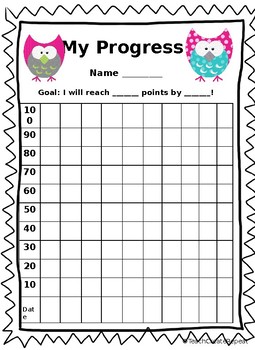
Self-Monitoring Progress Chart
Research shows that students who set goals for themselves and monitor their own progress and more motivated to learn and achieve their goals. These cute charts are a perfect way for students to set goals for themselves and track their own progress. These charts can be glued directly into student folders or used however you wish!
Subjects:
Grades:
1st - 6th
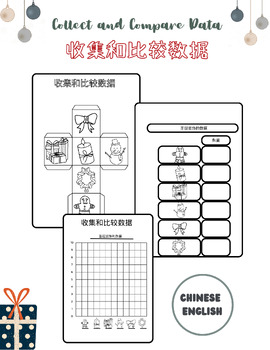
Iready Math - Collect and Compare Data Christmas 收集和比较数据 (English and Chinese)
This Lesson is in Math Iready curriculum (1st grade and 2nd grade) - Collect and Compare Data. To help your child or students to learn how to collect and use data.
Subjects:
Grades:
PreK - 3rd
CCSS:

Measuring & Graphing with an Amaryllis
Choose from four graphs as you measure and record growth of an amaryllis (purchased from your local store.) The graphs include:
Measuring in Inches (2 options)
This graph records growth of up to 15 inches and allows the user to write in the number of days or use 30 days marked in 5-day increments. Some users will record growth daily for 30 days while others may wish to set the scale for every 2 or 3 days and record for a longer period of time. When recording in inches, I suggest measuring to th
Subjects:
Grades:
2nd - 6th
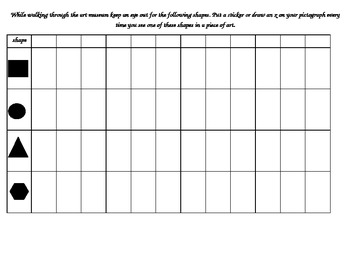
art museum pictographs field trip
Here are a couple resources to use to make a trip to the museum a meaningful educational experience for younger students. There are two pictographs. Have the students search for the color/shape listed on the pictograph. When they find one that matches they can either place a sticker in the box or place an x in the box (some art museums will not allow children to have writing utensils in the museum) If you like these check out my additional resources, including some for the older student, for art
Subjects:
Grades:
PreK - 3rd

EASTER BUNNY PICTOGRAPH
THIS IS A FUN EASTER GRAPHING ACTIVITY! THIS GREAT MATH WORKSHEET IS FOR GRADES 1ST, 2ND, AND 3RD! THIS PICTOGRAPH WILL HAVE STUDENTS THINKING DEEPER WHILE HAVING FUN!THESE QUESTIONS ARE DESIGNED TO MIMIC WHAT STUDENTS WILL SEE ON TESTING. Terms of Use:This file comes with a limited-use license for the original download only. Please do not share without purchasing multiple-use licenses. © Copyright 2023 Inspiration in Bloom. All rights reserved. Permission is granted to copy pages specifically f
Subjects:
Grades:
1st - 3rd

4 Square: A Hands-On Coordinate Geometry Game
This resource pack includes:- 1 unique copy of the 4-Square game board (you may make any additional copies)- a How-to-Play game video teaching all of the rules and math concepts- a QR code to access all resources at any time- a link to a computerized number generator for use in this game- links to 3 videos (a math concept skill video, a how-to-play-game video, and a 3-act task math talk video)- math practice assessment sheet- answer guides Players take turns rolling 3 dice (a link to digital dic

ST. PATRICKS DAY PICTOGRAPH
THIS IS A FUN ST. PATRICKS DAY GRAPHING ACTIVITY! IT CAN BE USED BY TEACHERS IN A CLASSROOM OR HOMESCHOOL FOR A LESSON, OR HOMEWORK, OR A PARENT JUST WANTING TO ASSIST THEIR CHILD IN LEARNING FURTHER. GRADES 1ST, 2ND, AND 3RDTHESE QUESTIONS ARE DESIGNED TO MIMIC WHAT STUDENTS WILL SEE ON TESTING. Terms of Use:This file comes with a limited-use license for the original download only. Please do not share without purchasing multiple-use licenses. © Copyright 2023 Inspiration in Bloom. All rights re
Subjects:
Grades:
1st - 3rd

Common Core Standards for Measurement and Data for K-5
The Common Core Standards for Measurement and Data for K-5 are listed.
Subjects:
Grades:
K - 5th

Pictograph Fun For All Ages
This is an excel document for busy teachers whom are trying to teach students to read picture graphs. The teacher will be able to edit the document as pleased. Two sheets are created and the format is very easy to use. It can also be used with the smart board in the classroom.
Grades:
PreK - 12th
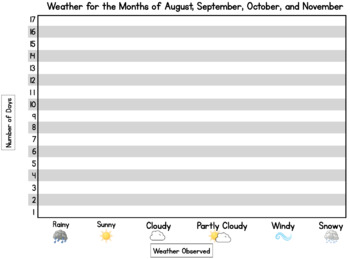
Weather Graphs
Bar graph, pictograph, and tally chart for graphing weather. Includes one of each type with numbers and weather, and also a blank one of each.
Grades:
PreK - 4th
Bird Watching
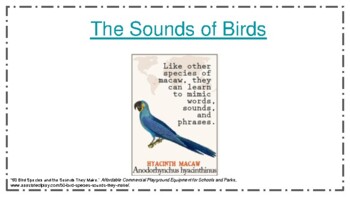
One interactive activity with lots of ways to integrate multiple standards applicable to many grade levels.Go outside and discover what birds are in your area. •Use the link to study the chart and the bird calls. •Predict what birds you think you will hear around your house and community. •Draw the different birds you hear. •Listen for 20 to 30 minutes a few days a week and graph what birds you hear. •After identifying birds in your area, research what those birds need to survive in their enviro
Subjects:
Grades:
3rd - 6th
NGSS:
MS-LS1-4
, K-LS1-1
Weather Tracking Basics
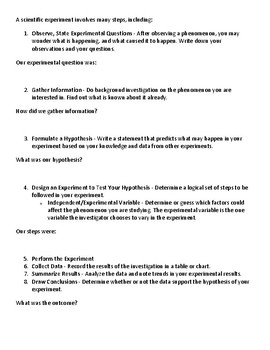
I created this for a combined science and math homeschool lesson plan on tracking weather over a period of time.My son studied previous year's early spring temperature averages (March 21st to May 1st) and made predictions about whether 2019 would be more or less. We set up a scientific method experiment and created a bar chart where we tracked highs and lows.We found the average for each day, average for period, and the range/median/mode for the period as well.We tested our results against our p
Subjects:
Grades:
3rd - 5th
CCSS:
Weather Data Collection Activity
This activity can be used in upper elementary classroom while learning about weather, but also connecting data collection standards to the activity.
Subjects:
Grades:
3rd - 7th
Showing 1-21 of 21 results


