10 results
General science Common Core 3.MD.B.3 resources for homeschool
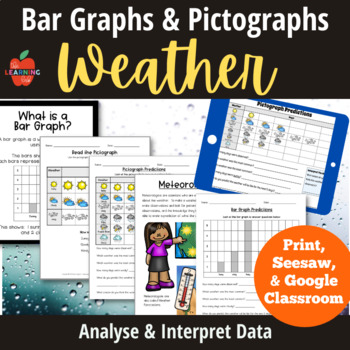
Weather NGSS ESS2: pictographs, bar graphs, forecasting, predictions, posters
Weather Bar Graphs and Pictographs for observing, analyzing and interpreting data! This package is both printable and digital (for Seesaw AND Google Classroom.) NGSS ESS2: Earth's Systems. Look at typical weather patterns, use data to make predictions, and consider connections to seasons!Printable 30 pages* Weather Forecast Worksheets (3 versions) *What is a Pictograph definition (2 versions) *Read the Pictographs worksheets *Meteorologist Fact Sheet (also with practice pictograph) *Pictograph P
Subjects:
Grades:
2nd - 6th
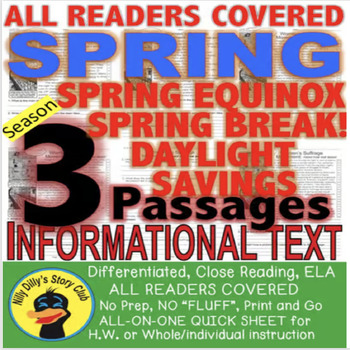
Spring Break & Daylight Savings Equinox, CLOSE READING 5 LEVEL PASSAGES CCSS
Common Core Listed and Aligned!LEVELED PASSAGES! CHOOSE EACH STUDENT'S READING LEVEL. ALL STUDENTS WILL HAVE SAME CONTENT, VOCAB, AND QUESTIONS!ALL READERS COVERED! 3 INFORMATIONAL TEXT 5 LEVELS EACH PASSAGE!-SPRING EQUINOX-SPRING BREAK FACTS-DAYLIGHT SAVINGS TIME FACTSDifferentiated Curriculum 5 levels Main IdeaFluency CheckClose ReadingTDQ's(REAL)Picture with Annotation and ELA QuestionEXTRA TDQ's Sheet to print on the backSAME CONTENT/SAME VOCABALL-ON-ONE SHEET TO Save Time and Paper!Print-N-
Subjects:
Grades:
2nd - 5th
Types:
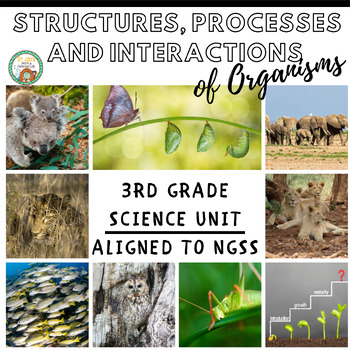
3rd Grade Science: Structures, Processes, and Interactions of Organisms
This unit engages students in inquiry-based activities to help them gain a conceptual understanding of life cycles, animals benefits from living in groups, adaptations and natural selection. Many opportunities for data collection and analysis are embedded in the mini unit allowing teachers to integrate math standards. This Unit was designed to address these NGSS Science Standards for 3rd grade:3-LS1-1. Develop models to describe that organisms have unique and diverse life cycles, but all have
Subjects:
Grades:
3rd - 5th
Types:
NGSS:
3-LS2-1
, 3-LS4-3
, 3-LS4-2
, 3-LS1-1
Also included in: Custom Bundle for Jessica (Tennessee 5th Grade Science)
bar graph pie graph graphing thermometer lab PowerPoint STEM 3 4 5 6 TX TEKS
This fun, hands-on, lab and graphing activity gets your students thinking deeply and putting their knowledge of graphing, gathering data, and following instructions to the test. Perfect for test prep! Great way to incorporate science, technology, engineering, and math (STEM) concepts into a fun lesson. This lesson was created for elementary and middle school students and is great practice to help students reinforce the concepts of graphing, data gathering, creating bar graphs, creating pie graph
Subjects:
Grades:
3rd - 6th
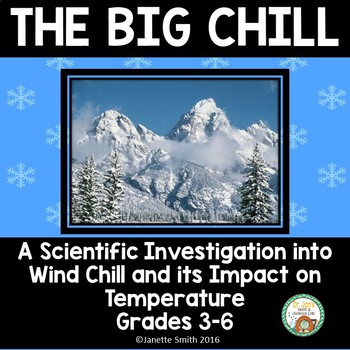
Temperature and Wind Chill: An Integrated Weather Activity
This engaging cooperative activity includes simulating a real life scenario to investigate the impact of wind and water on temperature. Math activities such as thermometer reading practice and making bar graphs are integrated within this activity.
Aligned to Next Generation and Common Core Standards.
Appropriate for grades 3-6.
Please leave feedback and earn TpT credits for future purchases.
If you like this download, you might also like these similar products:
Photosynthesis
Atomic Struc
Subjects:
Grades:
3rd - 6th
Types:
Also included in: Weather Super Bundle
Leap Year STEM Challenge
The Leap Year STEM Challenge is a huge hit with my students. Their eyes light up when they see a STEM challenge on our agenda and your students will too! There is just something special about planning and building your own work and testing it to. It is so much fun to watch the concentration on their faces as they work out what they want to do and how they are going to do it, and their joy when they succeed. This challenge is one you must try!STEM activities provide the perfect opportunity for ha
Grades:
2nd - 7th
Types:
Also included in: Leap Year STEM Bundle
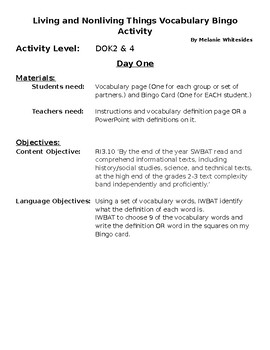
Living and Nonliving Things Science Vocabulary Bingo Activity
This is a Science Activity Lesson based on the Science Standard about Living and Nonliving Things. It also ties in with Math Standards regarding creating and reading bar graphs and number lines. While that standard pertains to 3rd grade many other grades need to review and reteach it to help students. This activity helps ESL students and others to master the vocabulary for the science standard as well. This activity is a DOK level 2 and 4 but is not complicated. It will take 3 days and all paper
Subjects:
Grades:
3rd - 11th, Adult Education
Types:
CCSS:
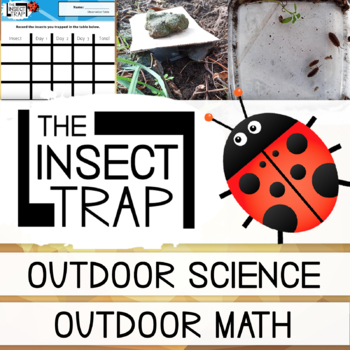
The Insect Pitfall Trap Science Investigation - Livings Things - Data Handling
The insect trap investigation gets students looking closely at all the amazing creepy crawlies that can be found in your outdoor space by creating small traps. It’s great if you’re looking at living things, habitats, or data handling as well as developing key investigation skills.Ages 4 - 6: Students will set the traps and observe what they collect. At this age it’s great for them to explore the wildlife, talking about their looks, how they move, key features, and other general observations. Onc
Subjects:
Grades:
K - 5th
Types:
Next Generation Science and Engineering Standards Posters NGSS 3rd Grade 8.5x11
Brighten your classroom & support your implementation of the Next Generation Science lessons with these standards posters! Trendy polka dots and popular Whimsy Clips, clip art, help make these 3rd grade standards posters an engaging tool in your classroom! Each 8 1/2 x 11 poster includes the standards using “I” statements and is grouped by strand.Happy Teaching!PRINTING DIRECTIONSThe included files may be opened and printed from any PDF Reader. •Download and save the file•Right click on the
Subjects:
Grades:
3rd
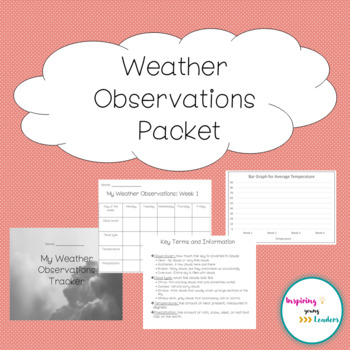
Weather Observations Packet
This packet allows students to gather, record, and evaluate the weather data that they collect themselves. The students are able to record their data in a daily chart (five days a week), and then can evaluate their data by seeing the weather patterns over the course of four weeks. They can also figure out the average temperatures and precipitations over a week and transfer them to bar graph and line graph forms. At the end of the packet, there is a key that the teacher can go over at the start o
Subjects:
Grades:
2nd - 4th
NGSS:
3-ESS2-1
Showing 1-10 of 10 results

