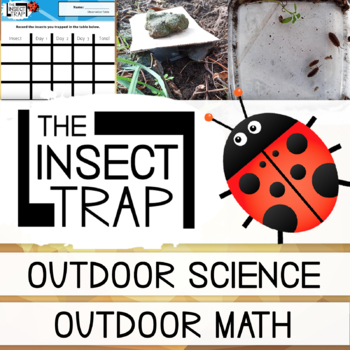
The Insect Pitfall Trap Science Investigation - Livings Things - Data Handling
- PDF
Description
The insect trap investigation gets students looking closely at all the amazing creepy crawlies that can be found in your outdoor space by creating small traps. It’s great if you’re looking at living things, habitats, or data handling as well as developing key investigation skills.
Ages 4 - 6: Students will set the traps and observe what they collect. At this age it’s great for them to explore the wildlife, talking about their looks, how they move, key features, and other general observations. Once they’ve had time to study what they’ve trapped they can compete the observation sheet where they’ll draw what they’ve collected.
Ages 7 - 9 & 10 - 12: Students will set the traps and wait to see what crawls inside (checking each day for a few days. They’ll identify the creatures and record their results on the results table. They can then use their results to create a bar graph of their findings (you can choose to accumulate all the results or just use individuals). After that, get them to complete the evaluation question sheets which will encourage them to think about how successful their traps were and the reasons behind their results.
Equipment needed:
- Activity pack
- Trowel
- Yogurt pot
- Tray
- Card
- Stones
- ID Guide (optional)
-----------------
Check out our outdoor science bundle here.
------------------------
Please don’t forget to rate this product and provide feedback to earn credits that you can use toward future purchases on TpT.
Also, be sure to visit my store and FOLLOW ME to see my new products and hear about upcoming sales!


