73 results
7th grade graphing resources for Microsoft OneDrive and for GATE
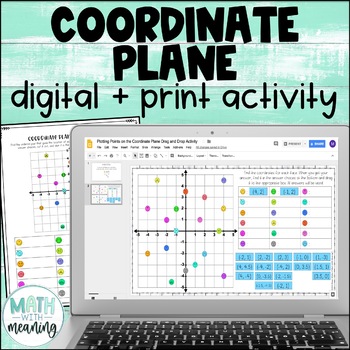
Coordinate Plane Activity - Digital and Print - Plotting Points 4 Quadrants
Looking for a fun way for students to practice using the coordinate plane? Students will practice writing ordered pairs for points on the coordinate plane with this no-prep digital activity! Students will find the ordered pairs for 18 colorful emoji faces on the coordinate plane.The ordered pairs do include decimals (halves only). Please view the preview file to make sure that this activity is appropriate for your students. This product includes the following:A link to the digital activity on Go
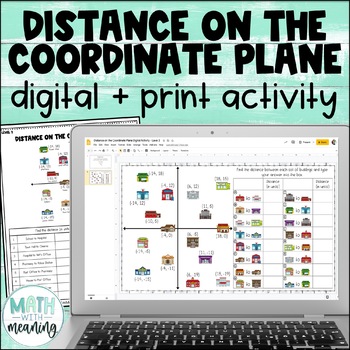
Distance on the Coordinate Plane Digital and Print Activity
Looking for an engaging, no-prep activity to practice finding distance between points on the coordinate plane? Students will find the distance between sets of buildings on a town map with this fun digital and print activity.There are 3 different levels of this activity included:Level 1: Points are shown on a coordinate plane with grid lines and axes go from -5 to 5Level 2: Points are shown on a coordinate plane with no grid lines and axes go from -20 to 20Level 3: Points are not shown on the coo
Subjects:
Grades:
5th - 8th
CCSS:
Also included in: Middle School Math Digital and Print Activity Bundle Volume 3
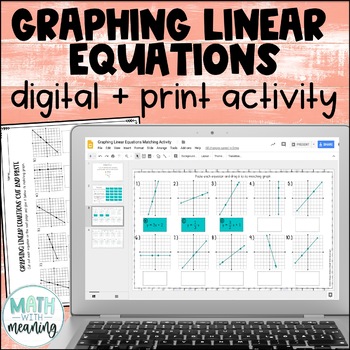
Graphing Linear Equations Digital and Print Activity for Google Drive
Looking for an engaging, no-prep activity to practice matching linear equations to their graphs? Students will match 20 equations to their graphs with this fun digital and print activity. Many of the equations are very similar and involve the same numbers, so students will need to work carefully!All equations are written in slope-intercept form. The graphs include positive, negative, zero, and undefined slopes. Please view the preview file to make sure that this activity is appropriate for your
Grades:
6th - 9th
CCSS:
Also included in: Middle School Math Digital and Print Activity Bundle Volume 2
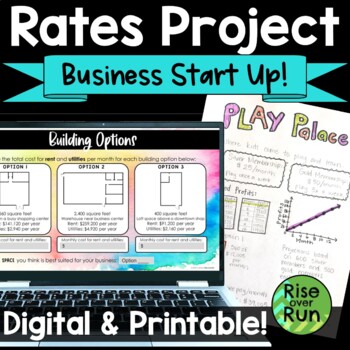
Rates & Proportional Relationships Real World Project
Students work with real world rate of change and proportional relations as entrepreneurs creating a business startup! They will love getting creative, and you will love that everything is ready to go to get them thinking about math. This project is included in printable PDF version, Google Slides, and PowerPoint.In this project, students get creative as they decide on a type of business, membership fees, and a building location. Then they must calculate their costs and profits based on those dec

Valentine's Day Heart Candy Stacking STEM Challenge
Valentine Day Heart Candy Stacking STEM Challenge❤️ will get your students collecting data, averaging, analyzing data, and graphing during the holiday. ⭐This activity can also be used for STEAM Activities, STEM After School Programs, Summer Programs, Clubs, Maker Spaces, or at home. ⭐This product is included in my STEM BUNDLE #2 Challenge! ⭐Other Products you might like:➩STEM Challenges For the Whole Year Bundle➩Back to School STEM Challenge➪STEM Waterbottle Challenges➩STEM Valentines Day Chal
Subjects:
Grades:
3rd - 7th
Types:
Also included in: STEM Challenges Entire Year includes End of the Year STEM Activities
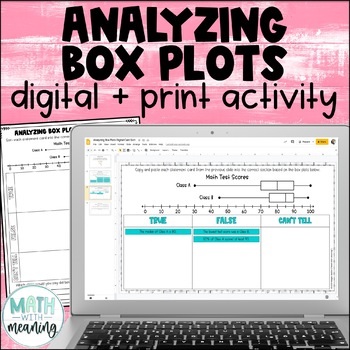
Box and Whisker Plot Digital and Print Card Sort - Reading and Analyzing
Looking for an engaging, no-prep activity to practice reading and analyzing box plots? Students will look at a double box plot and determine if statements about it are true, false, or if they can't tell from the information given in this fun digital and print activity.This activity includes statements about the minimum, maximum, median, quartile 1 (Q1), quartile 3 (Q3), interquartile range (IQR), and range of the box plots, along with statements about the percentages represented by a particular
Subjects:
Grades:
6th - 9th
Also included in: Middle School Math Digital and Print Activity Bundle Volume 3
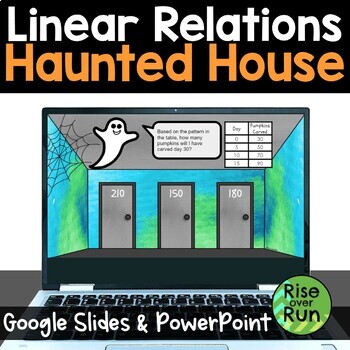
Digital Linear Relationships Halloween Escape Room Activity
Students will love this engaging practice activity for linear relationships. They must try to escape a haunted house! Includes Google Slides and PowerPoint versions. They are given 14 problems to solve, choosing from 3 possible answers for each one. If they solve correctly, they will choose the correct door and avoid the scary giant spiders! If they make a mistake, a spider appears, and they are prompted to try again. Problems include linear graphs, table of values, equations, and stories. Thi
Grades:
7th - 9th
Types:
CCSS:
STEM Escape Room - The RMS Titanic
This STEM Escape Room Challenge is a set of five tasks for students to complete. There are a lot of different ways you can complete these five tasks. We do all five tasks over the course of a Friday afternoon in our classroom, or over a span of about 2 hours. You could also do these over the course of 2-3 class periods and students can pick up where they leave off each day. Student teams work at their own pace, they must complete the tasks in order and complete each task before they can move
Subjects:
Grades:
3rd - 7th
Types:
Slope Digital Math Escape Room Activity for Halloween
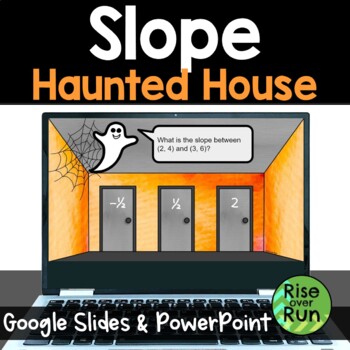
Students will love this fun practice activity for calculating slope between 2 points. Answering correctly will help them escape a haunted house! Includes Google Slides and PowerPoint versions. They are given 14 problems to solve, choosing from 3 possible answers for each one. If they solve correctly, they will choose the correct door and avoid the scary giant spiders! If they make a mistake, a spider appears, and they are prompted to try again. For each problem, students are given two ordere
Grades:
7th - 9th
Types:
Coordinate Plane Graphing Parabolic Curves Math & Art 4 Quadrants String Art
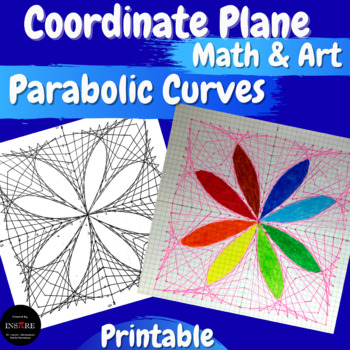
Geometry Math Project - Practice ordered pairs plotting by using this fun activity. Make beautiful parabolic curves by drawing a series of straight lines.It's a great activity for the First Days of School, Back to School, Summer Camp, Summer School, or End of the Year.Can we draw a beautiful picture using only straight lines? Yes, we can. Check out this math & art project.Why do students love mystery picture graphing? They love discovering the next parts of the picture and guessing what it w
Subjects:
Grades:
6th - 9th
Types:

Football Stats Math Project - Upper Elementary Math: Graphing and Analyzing Data
This Football Stats Project incorporates the use of line plots, stem and leaf plots, analyzing upward and downward trends in data and median, mode, range and outliers. I also incorporated discussion and higher order thinking skills. Students will apply these concepts and skills to football statistics that they will research - included are suggestions for websites to research and topics to research.This would be best for 4th, 5th or 6th grade math students.This resource includes slides that intro

Statistics Survey Project - Project Based Learning (PBL) with Math
Watch your students dive into the world of math as they create, execute, and analyze their own survey! Students will demonstrate mastery of data gathering, survey sampling, developing appropriate survey questions, data tables, Direct Variation, discrete graphs, dot plots, box and whisker graphs, and calculating the inter-quartile range.The Unique Survey Project is highly engaging, capitalizing on the innate curiosity of the adolescent mind. You will love the low-prep instructional guide. Your st
Subjects:
Grades:
6th - 10th
Types:
Also included in: Fun with Ratios Activities Bundle - 7th Grade PBL with Math
Finding Slope from Graphs, Tables, Equations, and Points Digital Card Sort
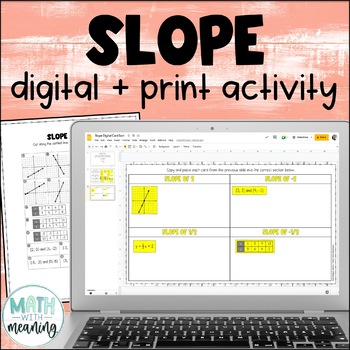
Looking for an engaging, no-prep activity to practice finding the slope when given a graph, equation, table, or two points? Students will sort 22 cards based on their slope in this fun digital and print card sort activity.Each problem gives either a table, a graph, two points, or an equation in slope-intercept form and asks students to find the slope. Please view the preview file to make sure that this resource is appropriate for your students.This product includes the following:A link to the ac
Grades:
6th - 9th
Also included in: Middle School Math Digital and Print Activity Bundle Volume 3
Function Fun, Unit 1: Patterns, T-tables, and Graphs
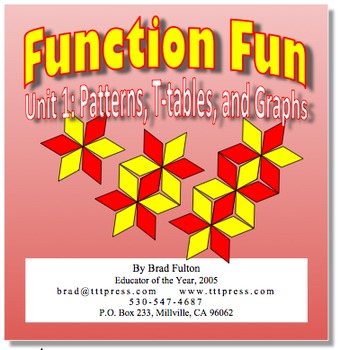
OVER 50 PAGES! These are the best strategies for teaching linear functions to all students. Tested in grades 4 through high school, this unit helps students develop competency with both the concepts and computations involved in functions. The multi-representational activities cover slope, y-intercept, t-tables, graphs, formulas, and visual representations of linear functions.This unit is part 1 of a four-part series and includes 17 patterns in both color and black and white versions to provide t
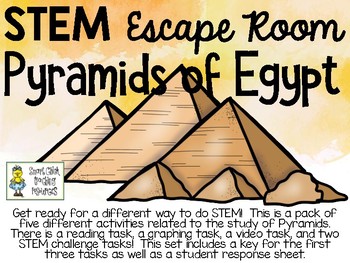
STEM Escape Room - PYRAMIDS of EGYPT
This STEM Escape Room Challenge is a set of five tasks for students to complete. There are a lot of different ways you can complete these five tasks. We do all five tasks over the course of a Friday afternoon in our classroom, or over a span of about 2 hours. You could also do these over the course of 2-3 class periods and students can pick up where they leave off each day. Student teams work at their own pace, they must complete the tasks in order and complete each task before they can move
Subjects:
Grades:
3rd - 7th
Types:
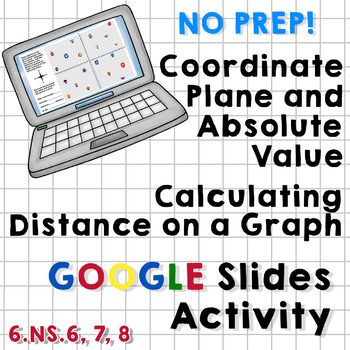
Coordinate Plane/Absolute Value/Distance on a Graph Google Slides Activity
This Google Slides Activity includes 14 slides containing basic reminders about the setup and use of a coordinate plane, calculating distance on a graph using absolute value, and describing directions as they relate to crossing over the axes.Students are asked to find the coordinates of several locations in "Grid Town" and then to describe the number of "city blocks" needed to travel to get from one destination to another. They are asked to use directional words (north/south/east/west) and dete

Easy Chemistry - atoms, elements, and molecules
This is a beginners unit that introduces elementary students to chemistry basics. It covers atoms, elements, molecules, the periodic table, and Mendeleev. This unit uses backwards learning in that the students do the fun activities and then use critical thinking skills to relate their learning back to chemistry fundamentals. I used this unit with my fourth and fifth grade Gifted and Talented students and they loved it. Their learning was much deeper due to the activities which include block
Subjects:
Grades:
5th - 7th
Types:
Digital Mad Lib Math Activity - Identify Slope and Y-Intercept from a Graph
No prep. No paper. No materials. Totally digital. Great for Distance Education, 1:1, BYOD, or math computer centers. Google Drive, Google Classroom, and Microsoft One Drive.Students look at a graph and determine the slope and the y-intercept.This is an interactive, digital mad lib for math. Students work through 15 slides. Each slide consists of a problem and four possible choices. Students select their answers and then type them into the appropriate spaces on the last slide. The answers will cr
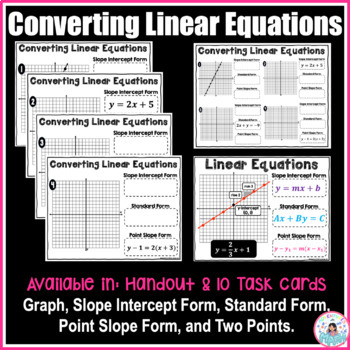
Converting Linear Equations: Slope Intercept, Standard, Point Slope, Two Points
The activity has 10 linear equations task cards. Students are only given one form in each problem (graph, slope-intercept form, standard form, point-slope form, or two points), and they are expected to determine the other forms.One version is the full-size page (one problem on one page). This can be done as task cards seated as partner work, or in small group centers.The other version is a handout, meaning there are four problems on one page. This would be great as a homework assignment after l

Fun with Ratios Activities Bundle - 7th Grade PBL with Math
The purpose of the Fun with Ratios Activities Bundle is to give students the opportunity to use creativity to apply ratios, proportions, and percentages in real-world settings. This bundle includes three unique tasks: Black Friday Mastery Task, Direct Variation Poster Mastery Task, and the Unique Survey Project. These activities and their accompanying materials are suited for students in grades 7 through 9. These lessons make excellent sub plans. Each project takes approximately two 60-minute bl
Subjects:
Grades:
7th - 9th
Types:
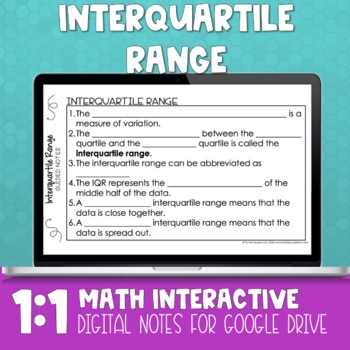
Interquartile Range Digital Math Notes
Interquartile Range (IQR) 1:1 Interactive Math NotebookAre you looking for a way to engage your math students in a 1:1 device environment? Check out my line of 1:1 Interactive Math Notebooks! Included in this product: -Interquartile Range Guided Notes-Interquartile Range Practice Page-Interquartile Range Frayer Models for Vocabulary Practice-2 different warm-ups -2 different exit slips -Answer Keys*Please note that the download includes a link to the product and a tutorial for teacher use. This
Subjects:
Grades:
5th - 8th
Types:
CCSS:
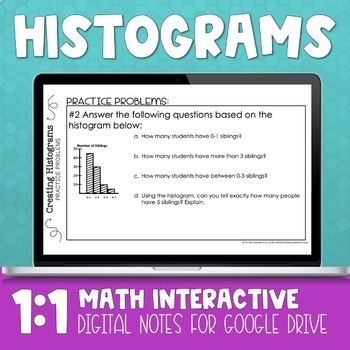
Histogram Digital Math Notes
Histogram 1:1 Interactive Math NotebookAre you looking for a way to engage your math students in a 1:1 device environment? Check out my line of 1:1 Interactive Math Notebooks! Included in this product: -Histogram Guided Notes-Histogram Practice Page-Histogram Frayer Models for Vocabulary Practice-2 different warm-ups -2 different exit slips -Answer Keys*Please note that the download includes a link to the product and a tutorial for teacher use. This product is best used in Google Drive or Micros
Subjects:
Grades:
5th - 8th
Types:
CCSS:
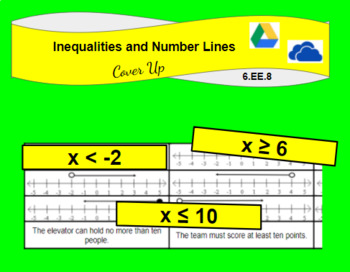
Inequalities and Number Lines Digital Cover Up Activity (6.E.E.B.8)
No prep. No paper. No materials. Totally Digital.
Great for 1:1, BYOD, or math computer centers. Google Drive, Google Classroom, and Microsoft One Drive.
This is an interactive, digital activity that can be used as homework, classroom practice, or as an assessment. Students interact by moving, dragging, coloring, or typing text on the slides.
In this activity, students read graphs on a number line and then find the matching inequality. They drag the inequality to cover up the matching graph.
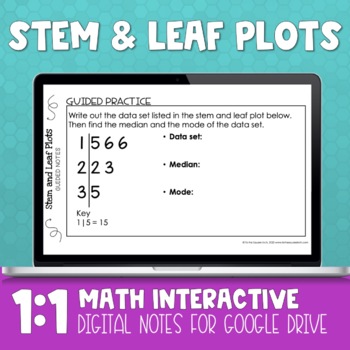
Stem and Leaf Plot Digital Math Notes
Stem and Leaf Plot 1:1 Interactive Math NotebookAre you looking for a way to engage your math students in a 1:1 device environment? Check out my line of 1:1 Interactive Math Notebooks! Included in this product: -Stem and Leaf Plot Guided Notes-Stem and Leaf Plot Practice Page-Stem and Leaf Plot Frayer Models for Vocabulary Practice-2 different warm-ups -2 different exit slips -Answer Keys*Please note that the download includes a link to the product and a tutorial for teacher use. This product is
Subjects:
Grades:
5th - 8th
Types:
CCSS:
Showing 1-24 of 73 results


