Rates & Proportional Relationships Real World Project

What educators are saying
Also included in
- If you enjoy teaching students using discovery learning and engaging activities with real world connections, this huge pack of resources is here to help you plan your entire year of 8th grade math.Lessons help you teach the standards, encourage discussions, and challenge students to think. StudentsPrice $225.00Original Price $386.46Save $161.46
- Do you love discovery learning, collaboration, hands-on activities, and projects that help students make sense of the math they are learning? This curriculum is packed with engaging and challenging Algebra I and 8th grade math resources for the whole year. A variety of activities, inquiry learningPrice $350.00Original Price $677.94Save $327.94
- Want linear functions lessons that are engaging to students and have real world applications? This unit is packed with tasks activities to help your students understand graphing linear equations!Included topics:Proportional RelationshipsSlopeSlope-Intercept FormPoint-Slope FormStandard FormThe activPrice $42.00Original Price $58.50Save $16.50
- This curriculum bundle includes a variety of activities, assessments, games, group activities, projects, inquiry lessons, guided notes, and more for teaching Algebra I CCSS standards. The activities are centered on discovery learning and engaging activities with real world connections. Lessons helpPrice $225.00Original Price $445.21Save $220.21
- Looking for seventh grade math resources that are engaging, meaningful, standards-based, and help build conceptual understanding? In this big pack are over 50 resources that include hands-on learning, card sorts, games, projects, collaborative group activities, and more! These activities are rigorouPrice $95.00Original Price $145.22Save $50.22
- Want to incorporate more PBL in your lessons? Challenge students to use what they have learned in class as they apply 8th grade standards in these real world application projects. Included are 6 engaging projects:Rates & Proportional Relationships Business Startup ProjectTransformations ArchitPrice $14.00Original Price $20.49Save $6.49
- Engaging and challenging resources to help students understand rates and proportional relationships. This bundle includes the following resources:Intro to Proportional Relationships Discovery LessonMultiple Representations of Proportional Relationships TasksGroup Coloring ChallengeComparing ProportPrice $16.00Original Price $22.00Save $6.00
- Want to incorporate more PBL in your lessons? Challenge students to use what they have learned in class as they apply 7th grade standards in these real world application and hands-on projects.Included are 6 engaging projects:Rates & Proportional Relationships Business Startup ProjectProbabilityPrice $13.00Original Price $17.50Save $4.50
Description
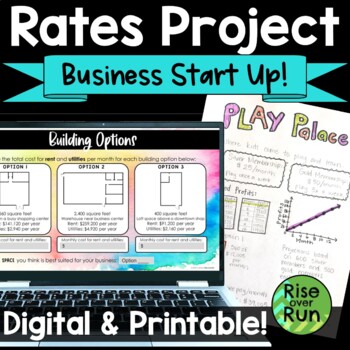
Students work with real world rate of change and proportional relations as entrepreneurs creating a business startup! They will love getting creative, and you will love that everything is ready to go to get them thinking about math.
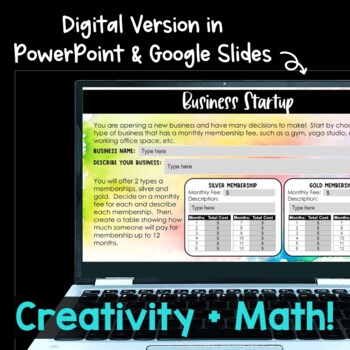
This project is included in printable PDF version, Google Slides, and PowerPoint.
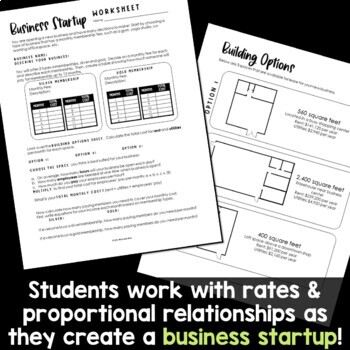
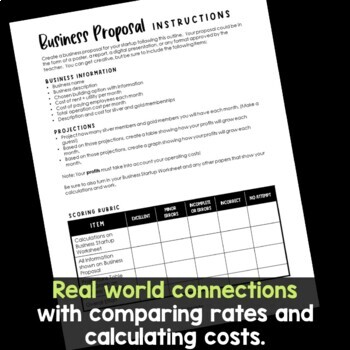
In this project, students get creative as they decide on a type of business, membership fees, and a building location. Then they must calculate their costs and profits based on those decisions and their own projections. They will compare rates as they make decisions, and they will create tables and graphs for their business proposal. Students get exposure to real world direct variation relations.
This activity is full of math and engagement. It works great as an individual project or for partners for in class face to face learning or online during distance learning.
A scoring rubric and sample work are provided in the PDF. (Many answers will vary depending on each students’ work.)

