32 results
Common Core 6.SP.B.4 laboratories for GATE
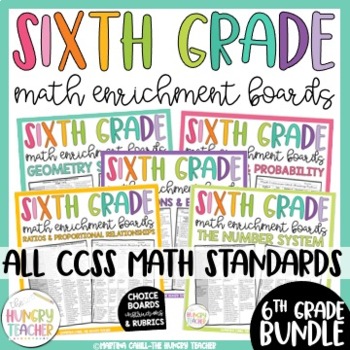
Math Enrichment Choice Board Sixth Grade for Ratios Statistics Number System
This resource includes math enrichment choice boards, rubrics, and instructions for every single 6th grade math Common Core State Standard for ratios, proportional relationships, expressions and equations, statistics and probability, geometry, and the number system. These are great for early finishers and students who need enrichment in math. Included in this pack are the math enrichment boards I use for my sixth grade learners who have mastered any of our math concepts and are now ready for a c
Football Stats Math Project - Upper Elementary Math: Graphing and Analyzing Data
This Football Stats Project incorporates the use of line plots, stem and leaf plots, analyzing upward and downward trends in data and median, mode, range and outliers. I also incorporated discussion and higher order thinking skills. Students will apply these concepts and skills to football statistics that they will research - included are suggestions for websites to research and topics to research.This would be best for 4th, 5th or 6th grade math students.This resource includes slides that intro
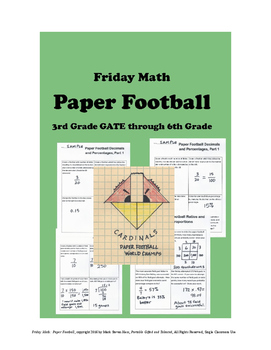
Friday Math - PAPER FOOTBALL - 3rd GATE through 6th Grade, 3 Levels of Challenge
In this lesson, we take goofing off to a new level. Imagine playing paper football as an assignment . . . this might take all the fun out of it forever!
This lesson is perfect for a Friday, for after a big test, for a test review, or as a center. It only takes about an hour and keeps kids engaged and thinking.
You will find three levels of challenge to meet the needs of a diverse group of learners make this set of lessons highly adaptable, and alignment to the Common Core Math Standards thre
Subjects:
Grades:
3rd - 6th
Types:
Also included in: KID CREATED GAMES Standards-based STEM and Math Games Bundle
Middle School/Upper Elementary Scientific Method and STEM Fair Unit
This unit was designed as a way to incorporate STEM into a more traditional Science Fair model with connections to STEM careers. Students are encouraged to choose a topic that they are deeply interested in and they learn how to connect scientific thinking to concepts outside of science class. They are also introduced to future STEM careers and community resources. The unit is directly aligned to Next Generation Science Standards (NGSS) and the Common Core.
In order to help students achieve t
Subjects:
Grades:
4th - 11th
Types:
Spring into Statistics Data Displays and Measures of Center Lab
This is a hands-on lab that teaches about Statistical Questions, Data Displays (dot/line plot, histograms, box plots) and Measures of Center (mean, median, mode, and range). The lab includes notes pages, examples with answer keys, and a final project in which the student can survey classmates and create a "flower" by using their data to find mean, median, mode, range. They will also create a box plot, histogram and dot plot.
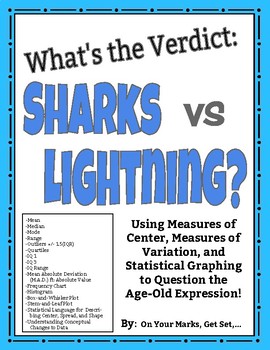
What's the Verdict: Sharks vs. Lightning? Modes of Center, Spread, and More!
Put it to the test! Use the age-old expression: "You are more likely to get struck by lightning than to be bitten by a shark!" to learn and practice Measures of Center, Measures of Spread, Measures of Shape, and Statistical Graphing including:MEANMEDIANMODERANGEOUTLIERS [Using IQR +/- 1.5(IQR)]QUARTILES [lower quartile (IQ-1) and upper quartile (IQ-3)]INTERQUARTILE RANGE (IQR)MEAN ABSOLUTE DEVIATION/ M.A.D. ft. ABSOLUTE VALUESYMMETRY/ASYMMETRY OF DISTRIBUTIONCLUSTERS AND GAPSBELL SHAPED CURVE AN
Subjects:
Grades:
5th - 12th, Higher Education, Adult Education
Types:
Take Me Out to the Ballgame: Baseball Math Enrichment Project
This is a real world enrichment project for those students who need some deeper work in mathematics. Students will use a variety of skills to complete this project including, research skills, elapsed time skills, measurement skills, and higher level thinking skills. This is a great way to provide differentiation in the classroom. There is a 3rd/4th grade packet and a 5th/6th grade packet included. This is great for gifted and talented students. It also can be a great family activity to work
Subjects:
Grades:
3rd - 6th
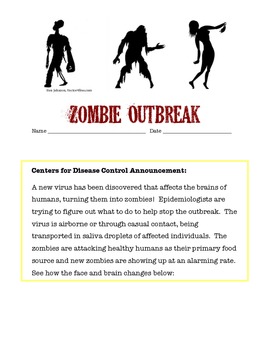
Investigating the Spread of a Viral Outbreak
Students in grades 5 - 9 model the spread of an infectious disease under the entertaining theme of a zombie outbreak. One student unknowingly is patient zero and students simulate the spread of an airborne illness. This highly engaging activity covers health topics, nature of science, and math skills as students graph data in a line plot. Higher level students can be challenged to find the function of the exponential growth of the outbreak.
Subjects:
Grades:
6th - 9th
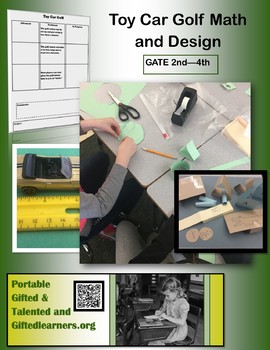
Toy Car Golf Math STEAM Design - Gifted and Talented GATE 2nd-4th 9 Hours
Engaging math and engineering with ramps and toy cars! Your students will go home and share the news about how absolutely cool school seems now. My mathematically gifted 2nd graders were VERY Challenged by this unit, and I would not hesitate to use it for 3rd grade GATE or in 4th grade as an enrichment for the whole class.Schoolhouse Rock Math: We’re using Zero My Hero and 5’s Multiplication to learn multiplication, repeated addition, and patterns to calculate areas of rectangles—a very advance
Subjects:
Grades:
2nd - 4th
Also included in: KID CREATED GAMES Standards-based STEM and Math Games Bundle
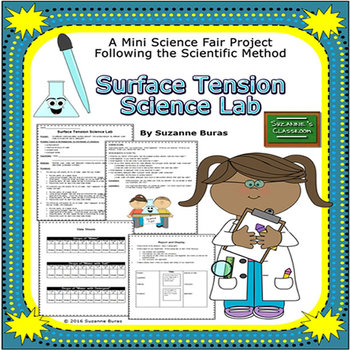
Mini Science Fair Project: Surface Tension Lab
This product was created for a classroom science lab designed to be used to introduce students to the scientific method and to doing a "real" Science Fair Project. It includes all parts of the scientific method and the Science Fair components. The experiment includes a blank lab sheet, detailed, step-by-step instructions for completing the lab, a data sheet, instructions for writing a science report, lab "slips" for grading participation in the lab, and an diagram for helping to set up a displa
Subjects:
Grades:
4th - 6th
Also included in: Scientific Method Bundle
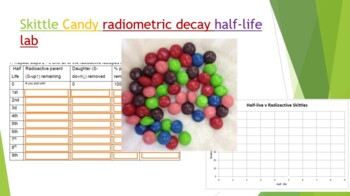
Skittle Radiometric Decay Half-life Lab
Did you know you can use Skittles candy to demonstrate absolute dating and radiometric decay! Buy a 1-4 lb bag at your local bulk warehouse store for savings. This lab is a great way to show how isotopes decay by shaking a plate full of random skittles. Students use Skittles to observe "Isotopes" decay over each half life. At the end of the lab (and only IF they have done all their work) they can enjoy their "daughter products". Skittles were used because they are durable, hypoallergenic, and th
Subjects:
Grades:
8th - 12th, Higher Education, Adult Education
Types:
NGSS:
HS-PS1-8
, HS-PS1-1
, HS-PS1-4
, HS-PS1-6
, MS-PS1-4
...
Also included in: Hands-on Science Semester Labs Bundle
Preventing The Spread of Zombie Germs!
Students in grades 5 through 8 can actually measure the effectiveness of hand washing in a scientifically controlled way. Students identify variables, complete data tables, graph results and analyze their data. Teachers will need access to a black light and a small drop of glow in the dark paint. Kids really enjoy this activity and it utilizes many Common Core skills.
Subjects:
Grades:
5th - 8th
Exploring Tides. Graphing Data and Patterns Project
This activity helps students to see the connection between the moon phases and the height of Tides. In this activity students are required to graph the height of the highest tides and the lowest tides of each day given. Then they compare that with the calendar for the new and full moons. The patterns help them discover the relationship between moon phases and tides. Excellent reinforcer of graphing skills with a science connection.
Grades:
5th - 9th
Types:
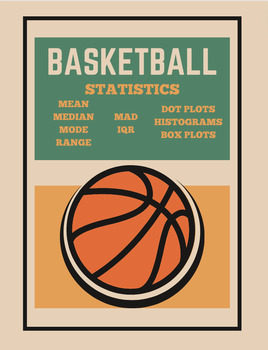
Basketball Statistics Project
Description: Engage your middle school students in the exciting world of basketball while reinforcing math and data analysis skills with this interactive Basketball Stats Project! This comprehensive resource is designed to captivate students' interest in both sports and mathematics, making learning both fun and meaningful.Take your students to the gym or outdoor playground hoop and they'll collect data on "How many baskets can ___ graders make in 60 seconds?" (the template is set to sixth grade
Subjects:
Grades:
5th - 8th
Types:
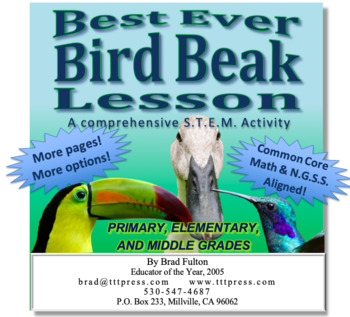
Best Ever Bird Beak Lesson
Students will enjoy participating in this engaging exploration that helps them understand the diversity of the animal kingdom and the concept of adaptation. They will mimic the feeding habits of birds with various types of beaks to learn how species have adapted to their environments. Options allow the lesson to be extended through the grade levels from primary to middle school and into math, technology, and engineering for a full S.T.E.M. experience.
Grades:
K - 6th
NGSS:
3-LS4-3
, 3-LS3-2
, 3-LS3-1
, MS-LS4-6
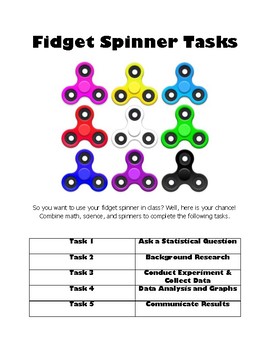
Fidget Spinner Tasks
This 5 part lesson combines math, science, and the fidget spinner craze! The five tasks incorporate 6th and 7th grade common core math standards in statistics and some geometry (area/circumference), along with the scientific method and writing.
Task 1: Ask a statistical question
-Includes identifying independent and controlled variables to design experiment fairly
Task 2: Background Research
-Includes drawing, describing qualities, calculating circumference and area of two circles, and weighing
Subjects:
Grades:
6th - 7th
Types:
Graphing Our Class Time Capsule Project
Infuse authentic learning into your math classroom by having your students complete this PBL to represent their class in graphs. The project is organized around the central question: How can we tell people in the future about our class using graphs to be placed in a time capsule? Students will examine historical graphs then come up with important ideas about their class to represent in graph form. Once they come up with a plan, they will conduct surveys and create a variety of graphs. Throughout
Grades:
3rd - 6th
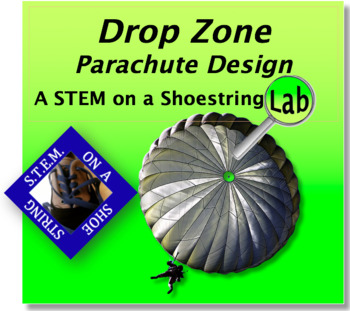
Drop Zone: Parachute Design Project-Based Learning Lab
This highly adaptable investigation will engage students of many ages and levels. Options for primary, upper elementary, and middle school are included. This is a true STEM lab that incorporates the science, technology engineering, and math components. Common, inexpensive, and easily available materials make this an easy lab to teach yet it produces maximum learning and engagement in your classroom. NGSS and Common Core Math Standards alignment are included in this "STEM on a Shoestring Budget"
Subjects:
Grades:
1st - 8th
Types:
STEAM Through the Year: Mathematics – January Edition
STEAM Through the Year: Mathematics for January guides you through the month with STEAM lessons and projects. Students build mathematical proficiency with monthly-thematic lessons correlated to the National Council of Teachers of Mathematics standards. Here you will find easy-to-use lessons providing practical strategies and problem-solving activities. The math and poetry lessons are themed around January special days and holidays – New Year’s Day, Celebration of Life Month, International Thank
Subjects:
Grades:
1st - 6th, Not Grade Specific
Types:
Fidget Spinners: Math in Motion
If a fidget spinner is better at holding a student’s interest than my math lesson, it’s not the fidget spinner than needs to go! Let’s use them to help the students see the math in their everyday life math in a fun and engaging way. Students will gather and interpret data, convert measurements of time, graph data, and even use online software if you wish.As a “S.T.E.M. in Action” lesson, you’ll find all four components of a true S.T.E.M. curriculum represented.Science — Students design an experi
Subjects:
Grades:
6th - 9th
Types:
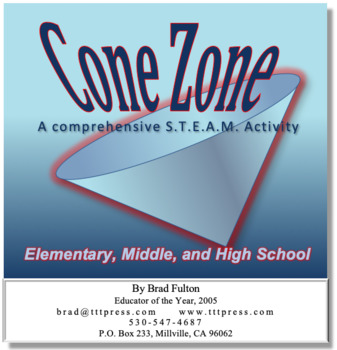
Cone Zone: A Comprehensive S.T.E.A.M. Activity
Students will design a cone-shaped descent chute for a planetary landing craft to optimize stability and minimize speed in this engaging lesson. This activity lends itself to student scientists of many ages. Young learners will benefit from simply creating the cones and testing their effectiveness. Older students can use spreadsheets that they create to analyze the data on a much more sophisticated level.
Grades:
5th - 9th
Types:
CCSS:
NGSS:
MS-ETS1-2
, 3-5-ETS1-3
, MS-ETS1-4
, 3-5-ETS1-2
, MS-ETS1-3
✏️ 6th Math Performance Task BUNDLE
This resource is a BUNDLE for all of my performance tasks! All 5 domains are included:✏️ Ratios & Proportions✏️ The Number System✏️ Expressions & Equations✏️ Geometry✏️Statistics & ProbabilityThese performance tasks can be used as a whole-group lesson, small groups, enrichment/extension activities, and so much more! The higher-order thinking problems will challenge students, encouraging them to use prior knowledge and a bit of scaffolding to demonstrate their learning of the standard
Subjects:
Grades:
5th - 7th
Types:
✏️ Statistics & Probability Performance Tasks
There are 4 separate performance tasks in this Google Drive Folder! You can work on them with your students, have them work in groups, or give it as an assessment! These are great problems that ensure even greater classroom conversations!
Subjects:
Grades:
6th - 8th
Types:
Also included in: ✏️ 6th Math Performance Task BUNDLE
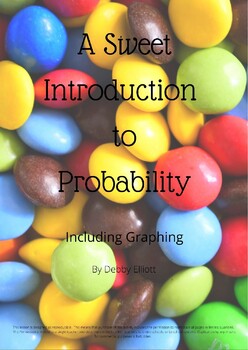
A Sweet Introduction to Probability
Students will be introduced to probability and graphing including:1) Making a bar graph2) Making a circle graph3) Making a line graph4) Forming a fraction based on data5) Convert a fraction to a decimal and percent6) Learn how to find the mean, median, and mode for average7) State the probability of finding a yellow candy in a bag
Subjects:
Grades:
6th
Types:
Showing 1-24 of 32 results

