TPT
Total:
$0.00

Basketball Statistics Project

;
Last Minute Learners
4 Followers
Grade Levels
5th - 8th, Homeschool
Subjects
Standards
Formats Included
  • Google Drive™ folder
$3.00
$3.00
Share this resource
Report this resource to TPT
Last Minute Learners
4 Followers
Made for Google Drive™
This resource can be used by students on Google Drive or Google Classroom. To access this resource, you’ll need to allow TPT to add it to your Google Drive. See our FAQ and Privacy Policy for more information.

Description

Description: Engage your middle school students in the exciting world of basketball while reinforcing math and data analysis skills with this interactive Basketball Stats Project! This comprehensive resource is designed to captivate students' interest in both sports and mathematics, making learning both fun and meaningful.

Take your students to the gym or outdoor playground hoop and they'll collect data on

"How many baskets can ___ graders make in 60 seconds?"

(the template is set to sixth graders, but can be edited to any grade level)

Key Features

  1. Hands-On Learning: This project encourages hands-on engagement as students collect and analyze data from actual basketball games.
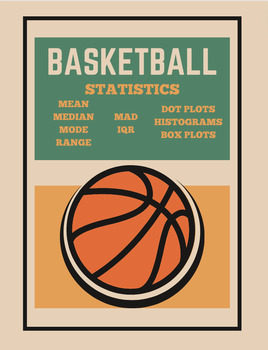
  2. Data Analysis Skills: Students will develop proficiency in data analysis, including calculating Mean, Median, Mode, Range, MAD, IQR
  3. Graphical Representation: Students will create visually appealing graphs and charts to present their findings, enhancing their data visualization skills including Dot Plots, Histograms and Box Plots.
  4. Assessment Tools: Assess student understanding with included rubrics and evaluation criteria aligned with math standards.

This Basketball Stats Project is perfect for math classrooms or homeschooling environments. It promotes collaborative learning, encourages critical thinking, and sparks students' interest in both sports and mathematics.

Total Pages
Answer Key
Rubric only
Teaching Duration
1 Week
Last updated 3 months ago
Report this resource to TPT
Reported resources will be reviewed by our team. Report this resource to let us know if this resource violates TPT’s content guidelines.

Standards

to see state-specific standards (only available in the US).
Recognize a statistical question as one that anticipates variability in the data related to the question and accounts for it in the answers. For example, “How old am I?” is not a statistical question, but “How old are the students in my school?” is a statistical question because one anticipates variability in students’ ages.
Understand that a set of data collected to answer a statistical question has a distribution which can be described by its center, spread, and overall shape.
Recognize that a measure of center for a numerical data set summarizes all of its values with a single number, while a measure of variation describes how its values vary with a single number.
Display numerical data in plots on a number line, including dot plots, histograms, and box plots.
Summarize numerical data sets in relation to their context, such as by:

Reviews

Questions & Answers