3 results
10th grade statistics printables for Microsoft Excel
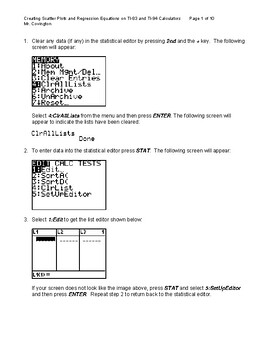
Creating Scatter Plots and Lines of best fit on TI-83/84 Graphing Calculator
A tutorial and reference guide for working with two-variable data to generate scatter plots and least squares method line of best fit on TI-83/84 graphing calculators and Microsoft Excel.
Subjects:
Grades:
8th - 12th, Higher Education, Adult Education
Types:

Overview of Mr. Bill's Store
I learned many years ago that the most effective way of keeping math engaging for students is through SELECTIVE PROBLEM SOLVING. All kinds of problem solving...not just traditional "solve this equation" problems. I will offer teachers ideas for keeping kids excited about math. Such as...building a probability distribution of outcomes from throwing dice...constructing a pendulum that will draw Lissajous figures...constructing a Foucault pendulum...how to do interesting large-scale astronomical
Subjects:
Grades:
5th - 12th
Types:
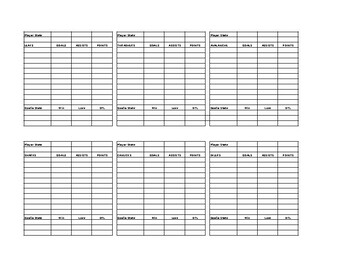
Intramural Hockey Stat Sheet
Hockey stats sheet for intramural floor hockey
Subjects:
Grades:
4th - 12th
Types:
Also included in: Intramural Hockey Package
Showing 1-3 of 3 results


![Preview of Year 10 Biology (Australian Curriculum) [Workbook]](https://ecdn.teacherspayteachers.com/thumbitem/Year-10-Biology-Australian-Curriculum-Workbook--6442923-1646016135/large-6442923-1.jpg)
