16 results
Free Kindergarten statistics microsofts
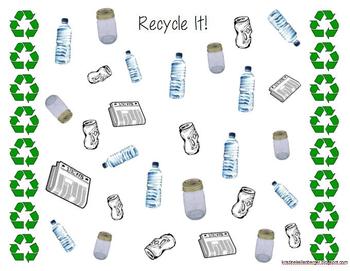
Recycle It! Tally Activity
This is my first worksheet to upload to TPT and I hope you can find it useful!This activity was created to incorporate Earth Day, recycling, and math concepts of tallying and graphing. Use the first page of the various items that we recycle (paper, glass, aluminum, and plastic) as a map to be left at a Math Center. The second page is the students' recording sheet. Students should mark a tally for each item, count the tallies, and then create a graph. There are two versions included, one full col
Subjects:
Grades:
K - 2nd
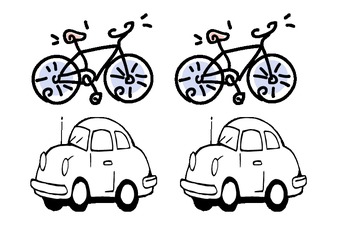
Picture Graph Pics - How the class travels to school
This is just a 4 page resource of pictures I used to introduce picture graphs to my year 1's.
There are four different pics - A bus, a car, a bike and someone walking.
I told the students that we were going to make a picture graph of how our class travels to school. We first made a tally table on the board and then students got the picture that matched their method of transport they take to school and got to colour it in. Once everyone had finished we made a big whole class picture graph.
A
Subjects:
Grades:
K - 2nd
Types:
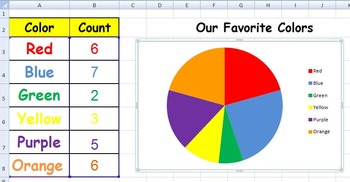
Graph Our Favorite Colors
This Excel spreadsheet will show your primary students the same data in a pie graph, a bar graph, and a line graph. You just need to survey your students about their favorite color and input the numbers into the graph. (When you first look at the graph, no data will be shown.)This spreadsheet offers more graphs:Primary Graphs Unit
Subjects:
Grades:
K - 2nd
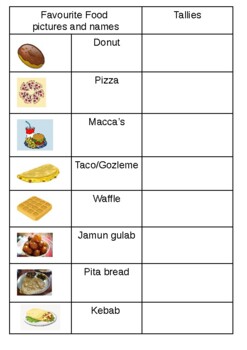
Maths - Data representation - favourite food pictograph activity cut and paste
Australian (Victorian Curriculum Year 1 and 2 levels), Maths - statistics and probability - Gathering data in a pictograph, modelling with class p.1, and task p. 2-4.Page 1 can be used as a teacher model and class data collection and pages 2-4 is the task for students that may use this for cut and paste activity to represent data using pictures for a pictograph. Foods are relatable to students of all countries.
Subjects:
Grades:
PreK - 4th
Types:
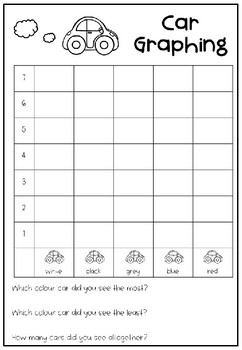
Car Graphing Activity Freebie!
This is the perfect opportunity to bring learning outdoors! For this fun graphing activity, students sit where they can see cars driving past and need to graph the different coloured cars that they see. After they have completed the graph, students answer questions and make simple inferences.Comes in coloured or B&W.
Subjects:
Grades:
K - 2nd
Types:
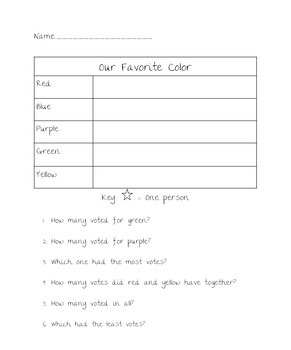
Favorite Color Pictograph
This is a blank "favorite color" pictograph to be filled out as a whole class survey activity with questions to answer at the bottom.
Subjects:
Grades:
K - 3rd
Types:
CCSS:
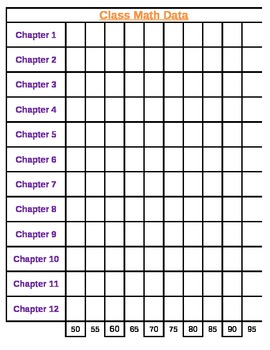
Math Class Data Sheet
Great for a class Data Wall!
This is an excel spreadsheet used to track yearly growth.
Enjoy!
Subjects:
Grades:
K - 12th

Common Core Standards for Measurement and Data for K-5
The Common Core Standards for Measurement and Data for K-5 are listed.
Subjects:
Grades:
K - 5th

Penny Toss Recording Sheet
Recording sheet for the penny toss game. Goes along with the Toss the Chips game from the Investigations math series.
Subjects:
Grades:
PreK - 2nd
Types:
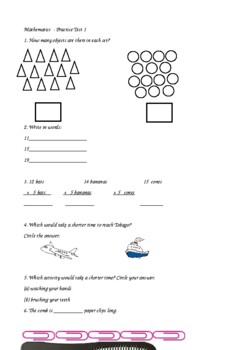
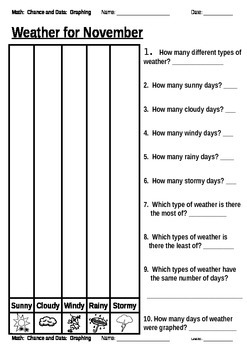
Column Graphs
A set of three column graphs for students in Grade One. The first graph is based on weather. The second is different ways we travel to school and the third graph is about different types of animals at the zoo. The last page in the document is a set of pictures for each of the graphs. Students simply cut out all the pictures, glue them into the correct columns and then answer the 10 questions that relate to the graph.
Subjects:
Grades:
K - 1st
Types:
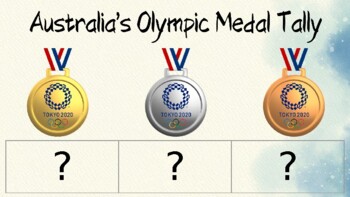
Tokyo Olympics Medal Tally PowerPoint Australia and general
Olympics medal tally.Australia and general.PowerPoint.
Subjects:
Grades:
PreK - 6th
Types:

Autumn themed numeracy worksheets
Numeracy worksheet focusing on data handling and counting.
Subjects:
Grades:
K - 2nd
Types:

How Does First Grade get to School Graph
Use this graph during back to school so your students can compare and contrast how they get to school through graphing. Begin as a do now with a whole class chart where they sign their name under how they get to school and continue as an independent graphing activity!
Subjects:
Grades:
K - 2nd
Types:

Sochi Olympic Medal Tally
A tally chart to keep track of Olympic achievement. Can be editted to fit classroom needs.
Subjects:
Grades:
PreK - 12th
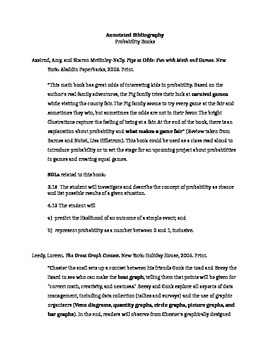
Probability Books
Integrate Math and Language Arts lessons with this annotated bibliography of great children's books to introduce probability and statistics to students.
Subjects:
Grades:
PreK - 2nd
Types:
Showing 1-16 of 16 results


