28 results
6th grade Common Core 3.MD.B.3 resources for Microsoft PowerPoint
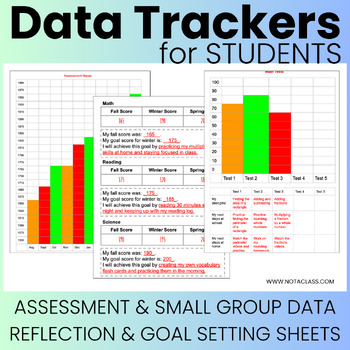
Data Trackers for Students - Printables for student data folders or binders
If you are looking for ways for students to track their iStation, I-Ready, NWEA MAP, unit tests, and any other district or state assessments then this product is for you. Reading bar graphs and organizing data are math standards in every state. So not only are students able to keep track of their data but they are learning or reviewing important math standards as well. All the pages are fully editable on PPT so that you can adjust them based on your students needs, scores and assessments. Whethe
Grades:
1st - 12th, Higher Education, Adult Education, Staff
Types:
Also included in: Data Trackers for Students and Teachers - Bundle | Editable
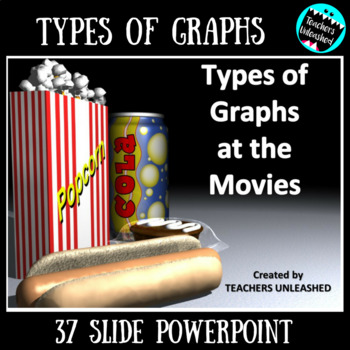
Understanding Graphs PowerPoint Lesson
Types of Graphs at the Movies
This 37-slide PowerPoint Presentation will give your students the tools they need to learn about bar graphs, double-bar graphs, line graphs, and pie charts. Students will review necessary graph vocabulary, walk through guided practice of each type (using strategies to understand what each question is asking), and complete the lesson with test prep style questions to determine mastery of the standard.
The theme of the PowerPoint is “Graphs at the Movies”, so s
Subjects:
Grades:
3rd - 6th
CCSS:
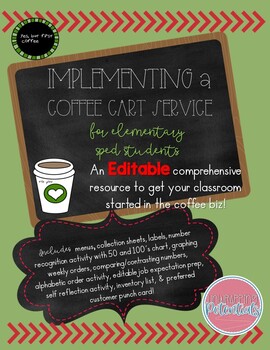
Implementing a Coffee Cart Service for Elementary Sped Students
Implementing your Coffee Cart Service is easier than you think when using this EDITABLE comprehensive resource! This resource contains EVERYTHING you will need to get your elementary classroom coffee biz up and running! This resource contains: 4 Varieties of Editable & Ready-Made Coffee Cart MenusWeekly Order Collection Sheet20 Coffee & Beverage Variety Labels6 Editable Beverage Labels 6 Creamer Variety Labels 6 Editable Creamer Labels3 Sugar Variety Labels Extension Activities Includin
Grades:
1st - 8th
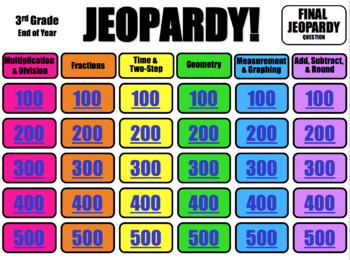
JEOPARDY - 3rd Grade Math - End of Year
JEOPARDY - 3rd Grade - End of YearNote: This PPT was created to prepare for the FSA (Florida Standards Assessment), which is a test that basically tests Common Core standards, but can be used for any 3rd grade class :) (or 4th, 5th, 6th, etc. grade review) Most questions are meant to be challenging so students can work together (though there are a FEW simple ones that students may be able to answer quickly) When I play this game as a class, I have students work in teams and ALL teams must submi
MATH GRAPHS & DATA Introduction to Various Graph Types PowerPoint PPT
This is a 36-slide PowerPoint presentation that provides the following information:
1. graphing vocabulary (data, scale, axis, interval, range, outlier);
2. definitions of and examples of 8 types of graphs (bar graph, double bar graph, line graph, line plot, stem-and-leaf plot, circle (pie) graph, pictograph, and histogram); and
3. a practice slide (with an answer slide to follow) for each type of graph.
Enjoy!
Deanne Davis, MCPSS
Subjects:
Grades:
3rd - 9th

bar graph pie graph graphing thermometer lab PowerPoint STEM 3 4 5 6 TX TEKS
This fun, hands-on, lab and graphing activity gets your students thinking deeply and putting their knowledge of graphing, gathering data, and following instructions to the test. Perfect for test prep! Great way to incorporate science, technology, engineering, and math (STEM) concepts into a fun lesson. This lesson was created for elementary and middle school students and is great practice to help students reinforce the concepts of graphing, data gathering, creating bar graphs, creating pie graph
Subjects:
Grades:
3rd - 6th
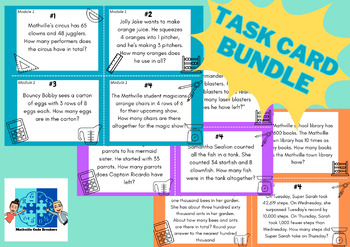
Grade 3, 4, 5 Beginning of Year Review Task Cards + Google Slides Companions
What Is It?Students will love using these task cards to review all of the main content covered during the previous year! Practicing last year's content will prepare your students for what's coming in the grade level that they're beginning.This bundle includes the beginning of year review task cards for Grades 3, 4 & 5.Guides on games for how to use the task cards are provided (Scoot, Scavenger Hunt, Beat The Clock, etc).We've also added all of the content from the cards as a PPT file in case
Subjects:
Grades:
3rd - 6th
Use CPALMS Centers and Whole group Activity K-5
This is Power Point to help teacher who are trying to Learn how to use CPALMS in their whole group lessons and in their small group lessons.This power point takes you step by step into transitioning your classroom instruction into success.
Subjects:
Grades:
K - 12th
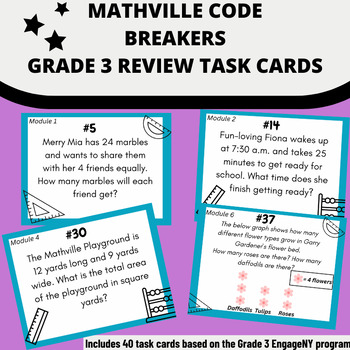
Grade 4 Beginning of Year Review Task Cards + Google Slides Companion
What Is It?Students will love using these task cards to review all of the main content covered in Grade 3! Practicing last year's content will prepare your students for what's coming in Grade 4.Guides on games for how to use the task cards are provided (Scoot, Scavenger Hunt, Beat The Clock, etc).We've also added all of the content from the cards as a PPT file in case you want to share them with parents, review the questions as a class, or post them as a morning challenge.This is a perfect back-
Subjects:
Grades:
4th - 6th
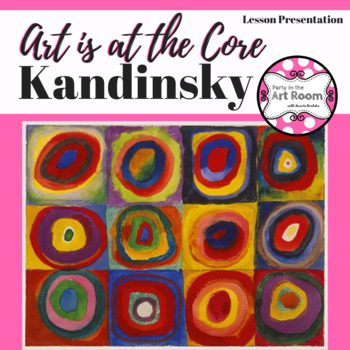
Kandinsky - Arts Integration Lesson Presentation
This is a presentation that accompanies my column Art is at the Core: Wassily Kandisky for Arts and Activities Magazine. I use this presentation to teach professional development for teachers and administrators. I also use it with my students. It contains a math lesson and writing/science ideas. The math lesson can be adapted to any grade level. To adapt the math lesson, choose an appropriate computation skill for the notecards mentioned in the slides.
Subjects:
Grades:
PreK - 12th, Staff
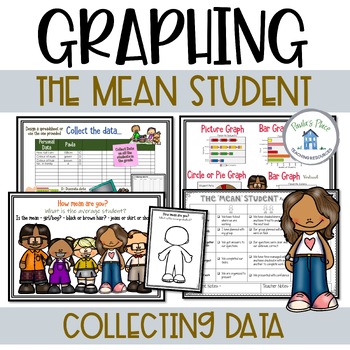
Graphing the Mean | Your Mean Student - Project Based Learning
Graphing the Mean - Your students will experience a math task that will lead to a group presentation. They will compose questions, collect data, collate data, determine the ‘mean’, show the data in various graphs and design a poster to present the ‘mean student’.Slides include-What the unit will cover-How mean are you? What will you be looking for?-What is the mean?-How mean are you?-Template for recording the mean student-Ideas for recording data-Group guidelines – it’s your turn-Types of graph
Subjects:
Grades:
4th - 6th
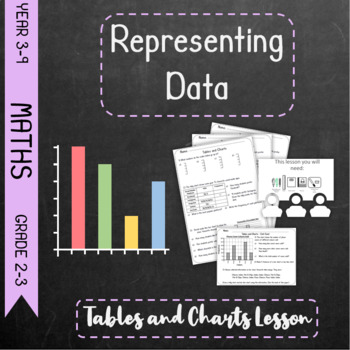
Representing Data - Charts and Tables Lesson
This resource consists of differentiated lessons, worksheets and print offs. The lessons are a set of 3 differentiations of the same lesson in PowerPoints form as well as a mixed version to allow you to differentiate on the fly. The worksheets are a set of 3 differentiations with some overlap in both PDF and PowerPoint form for easy editting. There is also an undifferentiated exit card for assessment purposes. This is a PDF.Finally there is a variety of print offs that can be used as lesson aids
Subjects:
Grades:
2nd - 9th
Also included in: *Bundle* Representing Data - Bar Charts and Tables *Bundle*
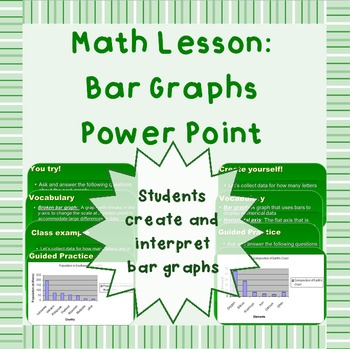
Bar graphs - Power Point presentation
This .ppt presentation is perfect for teachers who have students needing a refresher on bar graphs. It reviews the terminology of bar graphs (including broken bar graphs) and has students collect data in class and create a bar graph.
This is NOT a unit, assessment, or homework assignment.
This is in PPT Show format.
Other statistics PowerPoint lessons you may find useful:
Finding Mean Median Mode and Range Power Point Lesson
Basic standard deviation and distribution curves and statisti
Subjects:
Grades:
3rd - 7th
CCSS:
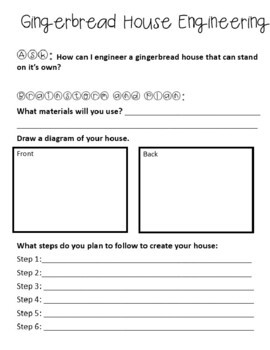
Gingerbread House Engineering STEM
Looking for a standards based activity for the holidays? Use this gingerbread house STEM project to teach or review the steps of the engineering design process. Extras:-This product also includes candy graphing to incorporate math skills.-Includes an editable parent letter to send home for donations.
Subjects:
Grades:
3rd - 8th
Types:
CCSS:
NGSS:
3-5-ETS1-3
, 3-5-ETS1-1
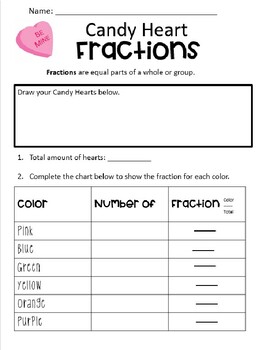
Valentine Fractions | Candy Heart Math
Fun no prep Valentine's Day math activities, just buy candy hearts!Skills included:-Naming fractions (parts of a group)-Comparing Fractions-Bar graphs-Picture graphs-Data table *Includes editable slides.
Subjects:
Grades:
2nd - 7th
Types:
BAR GRAPH: 4 weeks of BELL RINGERS with focus on data & science topic
BAR GRAPH: SURVEY-COLLECTING & INTERPRET DATAThis daily warm up introduces & applies surveying the class, interpreting and creating bar graphs for 4 weeks with a focus of science topics.It begins with an introduction of what a BAR GRAPH is along with TAILS - an acronym as to how to remember the parts of a graph.Through a 5 day pacing structure, with four different science categories, the lesson takes the students through a video which introduces topics like Zoology, Ornithology, and mor
Grades:
4th - 7th
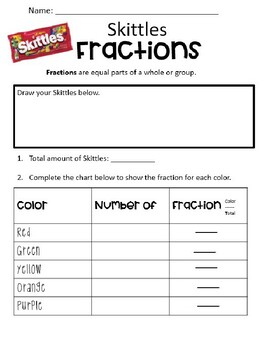
Skittles Fractions and Graphing
Just by the Skittles! No prep worksheets that include identifying fractions for part of a group, comparing fractions and graphing data with a data table, bar graph and picture graph. ** Includes editable slides.
Subjects:
Grades:
2nd - 6th
Types:
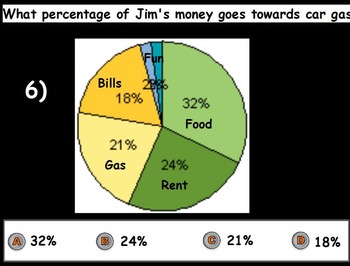
Basic Math Skills - Graphing Skills (worksheet included) (POWERPOINT)
This zip file contains a lesson on GRAPHING and BASIC GRAPHING SKILLS; the file contains all the materials necessary to teach the lesson, including a 25 slide Powerpoint lesson and a 3 page worksheet for the students that coincide with the Powerpoint lesson. The math involved is basic and was geared toward a special education class. However this lesson would be still useful to elementary or middle school level general education classes. . Along with the lesson material, this lesson includes a
Subjects:
Grades:
3rd - 6th
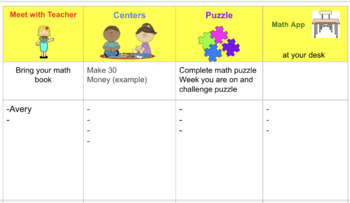
Editable Math Rotations Google Slides Powerpoint! Timers included
This is an editable, easy-to-follow math rotation Google Slides presentation. Easily create duplicates of slides to quickly rotate groups. Multiple options of timers are included to copy and paste into any part of your math rotation slides.
Grades:
PreK - 12th

Endangered Species Project
This project encompasses writing about endangered animals. It conforms to NGSS standards as well as Common Core standards for ELA and Math (California). It contains a rubric, graphic organizer, and examples for students. This project can be edited to fit your classroom needs.

Who Lives Here? - STEAM / STEAM Outside Bio Assessment-Remote Ready Lesson E
With this lesson, your students take a BASELINE count of the number and variety of plants and animals found just outside. My presentation helps them understand how to fill out their data sheets, and then off they go . . . outside to their EyeSpots for their own Biodiversity Assessment. Back inside, they graph and save their results. They can compile and use this to help them decide what project or projects they want to undertake to help their school’s biodiversity. They can use the same process
Subjects:
Grades:
3rd - 8th
NGSS:
5-ESS3-1
Rovers Presentation with Activity
Humans have dreamed of visiting Mars since the 1880s, but getting there isn’t easy. Using a game board modeled after the orbits of Mars and Earth, student teams will plot a course to Mars and back. As they plan their Mars mission, students will use the same navigation method that NASA uses for interplanetary travel - the Hohmann Transfer Orbit. You can use this STEM activity and the Rovers slideshow to introduce a Solar System unit or a Mars rover design project. In addition to planning their v
Subjects:
Grades:
3rd - 6th
NGSS:
3-PS2-2
, 4-PS3-1
, 5-PS2-1
Four Corners Get to Know You PowerPoint - Graphing and fractions
This power point includes 10 questions to play Four Corners as well as slides to print to label corners in the room. After each question is a graphing or fraction practice slide to incorporate math. This is great as a Back to School activity to help students get to know each other or to use as a math review game. Four Corners is a great way to get students moving in the classroom. This product is listed as a PDF, but it can be emailed as a Power Point if desired. Just leave me a message if you p
Subjects:
Grades:
1st - 6th
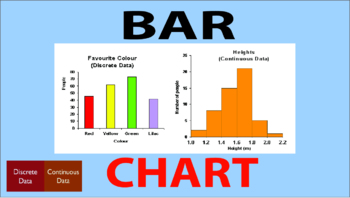
Bar Charts
Full detailed lesson plan on Bar chart (discrete and continuous data) with solutions, starter, interactive presentation, EAL support, assessment and plenary. Students will learn how to construct bar chart for discrete and continuous data. Also, students will learn what is frequency, variables (x and y axis).
Subjects:
Grades:
3rd - 6th
CCSS:
Showing 1-24 of 28 results

