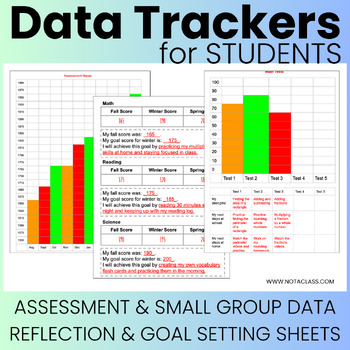
Data Trackers for Students - Printables for student data folders or binders
- PPTX
Also included in
- Data Trackers for Students:All the pages are fully editable so that you can adjust them based on your students needs, scores and assessments. Whether you are using the bar graphs or conference sheets, students will be able to keep track of their own data. These could be placed in student binders orPrice $5.99Original Price $7.98Save $1.99
Description
If you are looking for ways for students to track their iStation, I-Ready, NWEA MAP, unit tests, and any other district or state assessments then this product is for you.
Reading bar graphs and organizing data are math standards in every state. So not only are students able to keep track of their data but they are learning or reviewing important math standards as well.
All the pages are fully editable on PPT so that you can adjust them based on your students needs, scores and assessments. Whether you are using the bar graphs or conference sheets, students will be able to keep track of their own data. These could be placed in student binders or data folders. I would use sheet protectors as well so they don’t rip as easily. If your students are taking many different assessments then I would recommend color coding the data trackers. For example, print the state assessment trackers on blue paper, unit assessment on green, etc.
Click the links below to watch my step by step YouTube videos on how to use this product in the classroom. The teacher version explains each part of this digital product and tips on how you can use it in the classroom. The student version is a video you can play in the classroom and students can follow along. You can pause the video as needed for your classroom. You can play it on the projector for the whole class or have students watch it on their individual devices and work at their own pace.
For Teachers: https://youtu.be/cAkU2M2XGDI
For Students/Classroom: https://youtu.be/VSxNH6Mrtac


