62 results
6th grade Common Core 3.MD.B.3 microsofts
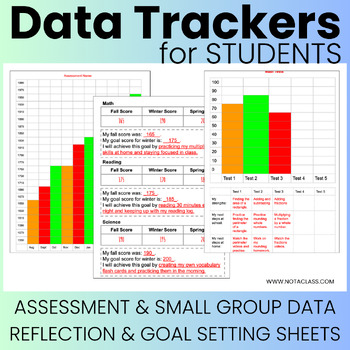
Student Assessment Data Trackers, Collection, & Goal Setting Sheets for Folders
These assessment data trackers and goal setting sheets are perfect for your student data folders and data collection for various tests in reading, math, and science. All the pages are fully editable, allowing you to adjust them based on your students' needs, scores, and assessments. You can place these in individual data folders for all your students or have them create these folders themselves. Consider color-coding the data trackers based on different grade levels, subjects, and periods. For e
Grades:
1st - 12th, Higher Education, Adult Education, Staff
Types:
Also included in: Data Trackers for Students and Teachers - Bundle | Editable
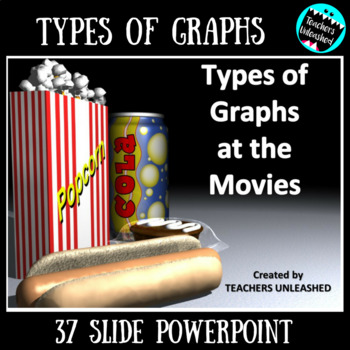
Understanding Graphs PowerPoint Lesson
Types of Graphs at the Movies
This 37-slide PowerPoint Presentation will give your students the tools they need to learn about bar graphs, double-bar graphs, line graphs, and pie charts. Students will review necessary graph vocabulary, walk through guided practice of each type (using strategies to understand what each question is asking), and complete the lesson with test prep style questions to determine mastery of the standard.
The theme of the PowerPoint is “Graphs at the Movies”, so s
Subjects:
Grades:
3rd - 6th
CCSS:
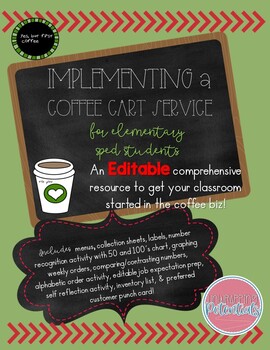
Implementing a Coffee Cart Service for Elementary Sped Students
Implementing your Coffee Cart Service is easier than you think when using this EDITABLE comprehensive resource! This resource contains EVERYTHING you will need to get your elementary classroom coffee biz up and running! This resource contains: 4 Varieties of Editable & Ready-Made Coffee Cart MenusWeekly Order Collection Sheet20 Coffee & Beverage Variety Labels6 Editable Beverage Labels 6 Creamer Variety Labels 6 Editable Creamer Labels3 Sugar Variety Labels Extension Activities Includin
Grades:
1st - 8th
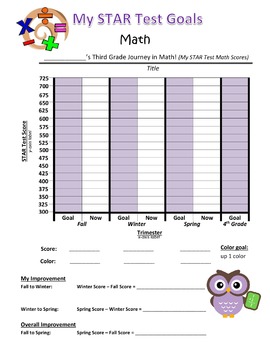
My STAR Test Goals - Student goal setting for standardized tests
This is a fully editable .DOC file that I have used to help my students set goals for their STAR test throughout the school year.
As a bonus, students can practice their measurement & data skills.
I have used this in a whole group setting, making an anchor chart with good test taking practices in order to help students brainstorm for the "two things I will do to reach my goal". I have also used this leading up to their STAR test and post STAR test during individual student conferencing.
Subjects:
Grades:
3rd - 8th
Types:
CCSS:
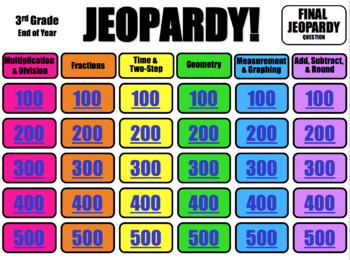
JEOPARDY - 3rd Grade Math - End of Year
JEOPARDY - 3rd Grade - End of YearNote: This PPT was created to prepare for the FSA (Florida Standards Assessment), which is a test that basically tests Common Core standards, but can be used for any 3rd grade class :) (or 4th, 5th, 6th, etc. grade review) Most questions are meant to be challenging so students can work together (though there are a FEW simple ones that students may be able to answer quickly) When I play this game as a class, I have students work in teams and ALL teams must submi
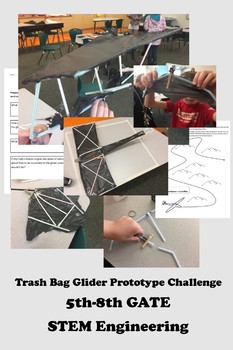
STEAM Glider Prototype Engineering Challenge for Upper Elem Gifted and Talented
We use the engineering process for this open-ended design challenge. All semester, my GATE kids have been building different gliders from blueprints, direct instruction, specific materials with patterns, and even store-bought balsa wood fighter gliders.
Now it’s time for the real test!
Can students construct—limited to specific resources—a glider which meets the three guidelines in the rules? As a bonus, can students research and apply physics knowledge to their real-world prototyping challen
Grades:
3rd - 8th
Types:
MATH GRAPHS & DATA Introduction to Various Graph Types PowerPoint PPT
This is a 36-slide PowerPoint presentation that provides the following information:
1. graphing vocabulary (data, scale, axis, interval, range, outlier);
2. definitions of and examples of 8 types of graphs (bar graph, double bar graph, line graph, line plot, stem-and-leaf plot, circle (pie) graph, pictograph, and histogram); and
3. a practice slide (with an answer slide to follow) for each type of graph.
Enjoy!
Deanne Davis, MCPSS
Subjects:
Grades:
3rd - 9th

bar graph pie graph graphing thermometer lab PowerPoint STEM 3 4 5 6 TX TEKS
This fun, hands-on, lab and graphing activity gets your students thinking deeply and putting their knowledge of graphing, gathering data, and following instructions to the test. Perfect for test prep! Great way to incorporate science, technology, engineering, and math (STEM) concepts into a fun lesson. This lesson was created for elementary and middle school students and is great practice to help students reinforce the concepts of graphing, data gathering, creating bar graphs, creating pie graph
Subjects:
Grades:
3rd - 6th
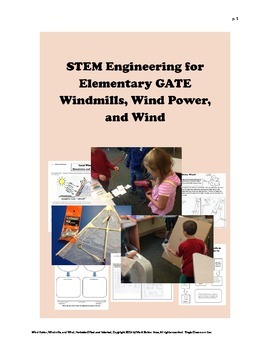
STEM Engineering for Elementary GATE - Wind Power, Windmills, and Wind
Two challenging but age-appropriate engineering projects highlight this unit. If you’ve taught my other STEM units, however, you know they’re not simply building projects. We’re thinking, learning science concepts, developing explanations, applying math and non-fiction reading skills, and bringing a wide variety of areas into a unit. But let’s not take lightly how cool it is to build and experiment with a cool mini glider and a working windmill!
As usual, we have ready-to-print activity shee
Subjects:
Grades:
3rd - 6th
Types:
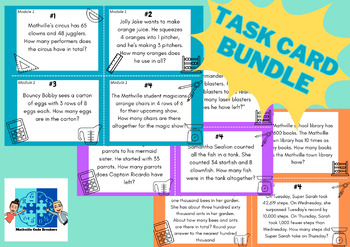
Grade 3, 4, 5 Beginning of Year Review Task Cards + Google Slides Companions
What Is It?Students will love using these task cards to review all of the main content covered during the previous year! Practicing last year's content will prepare your students for what's coming in the grade level that they're beginning.This bundle includes the beginning of year review task cards for Grades 3, 4 & 5.Guides on games for how to use the task cards are provided (Scoot, Scavenger Hunt, Beat The Clock, etc).We've also added all of the content from the cards as a PPT file in case
Subjects:
Grades:
3rd - 6th
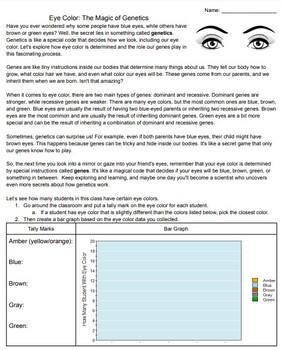
Eye Color: The Magic of Genetics Reading Passage and Graphing Worksheet
This is a worksheet and practice in collecting data and representing it in bar graph form, and is designed to help students understand the fascinating role of genetics in determining eye color.In this activity, students will explore the concept of genetics as a special code that influences our physical appearance, including eye color. They will learn that genes act as tiny instructions within our bodies, inherited from our parents at birth. This hands-on activity and reading passage will help s
Subjects:
Grades:
3rd - 6th
Types:
NGSS:
3-LS3-1
Excel Graphing Summer Fun with Digital Student Directions
The last marking period of the school year can be a challenging time to keep students engaged…they’re thinking about summer…you’re thinking about summer…#embraceitThis Summer Fun Excel project can be a perfect way to:* integrate technology* extend and enrich a math topic of study* introduce students to creating sheets and charts using ExcelProject file includes:* teacher notes/ classroom management suggestions* digital survey, using a Google Form, to collect summer activities data* digital stude
Subjects:
Grades:
3rd - 6th
Types:
Use CPALMS Centers and Whole group Activity K-5
This is Power Point to help teacher who are trying to Learn how to use CPALMS in their whole group lessons and in their small group lessons.This power point takes you step by step into transitioning your classroom instruction into success.
Subjects:
Grades:
K - 12th
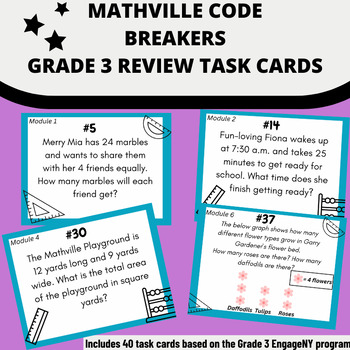
Grade 4 Beginning of Year Review Task Cards + Google Slides Companion
What Is It?Students will love using these task cards to review all of the main content covered in Grade 3! Practicing last year's content will prepare your students for what's coming in Grade 4.Guides on games for how to use the task cards are provided (Scoot, Scavenger Hunt, Beat The Clock, etc).We've also added all of the content from the cards as a PPT file in case you want to share them with parents, review the questions as a class, or post them as a morning challenge.This is a perfect back-
Subjects:
Grades:
4th - 6th
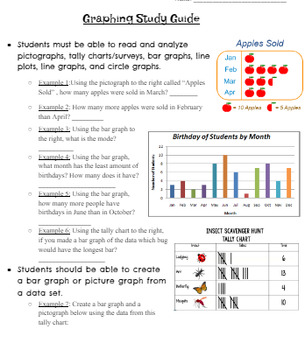
Graphing Unit Study Guide
This study guide outlines required graphing information for 3rd grade standards but also includes advanced graphing skills. It reviews pictographs, bar graphs, surveys/tally charts, line graphs, circle/pie graphs, line plots, probability, comparing two graphs, mean, median, mode, and range.
Subjects:
Grades:
2nd - 8th
Types:

Frank Stockton’s “The Lady or The Tiger” – 18 Common Core Learning Tasks!!
This Common Core resource includes 18 rigorous unit learning tasks for Frank Stockton’s short story, "The Lady or The Tiger.” The teacher-created learning tasks include standard(s) alignment using the language of Common Core State Standards. The unit activities represent a balance of analysis and evaluation activities focusing on a variety of literary elements, constructed responses, and extended informational/explanatory and argumentative writing. This resource also includes some embedded exter
Subjects:
Grades:
6th - 10th
Types:
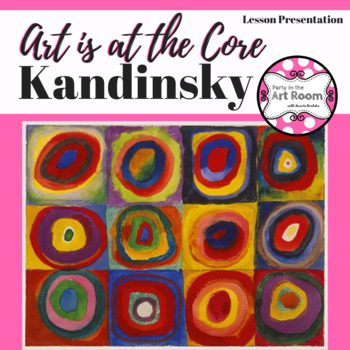
Kandinsky - Arts Integration Lesson Presentation
This is a presentation that accompanies my column Art is at the Core: Wassily Kandisky for Arts and Activities Magazine. I use this presentation to teach professional development for teachers and administrators. I also use it with my students. It contains a math lesson and writing/science ideas. The math lesson can be adapted to any grade level. To adapt the math lesson, choose an appropriate computation skill for the notecards mentioned in the slides.
Subjects:
Grades:
PreK - 12th, Staff
6 Editable Bar Graph Templates 2.0
Finally a simple and professional graph space that students can fill out without any design issues getting in the way. This file contains 6 ready-to-use graph options. Print them and have students fill them with pencil and ruler, or distribute them over computer and let them practice entering the data. Get a project perfect finish every time. Maybe you just want to fill it out live on a projector? The possibilities are endless! It's okay to say you love these bar graphs. So do we.Contains:- 2 bl
Living and Nonliving Things Science Vocabulary Bingo Activity
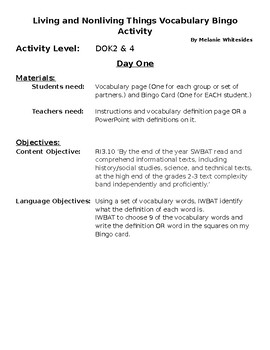
This is a Science Activity Lesson based on the Science Standard about Living and Nonliving Things. It also ties in with Math Standards regarding creating and reading bar graphs and number lines. While that standard pertains to 3rd grade many other grades need to review and reteach it to help students. This activity helps ESL students and others to master the vocabulary for the science standard as well. This activity is a DOK level 2 and 4 but is not complicated. It will take 3 days and all paper
Subjects:
Grades:
3rd - 11th, Adult Education
Types:
CCSS:
Graphing the Mean | Your Mean Student - Project Based Learning
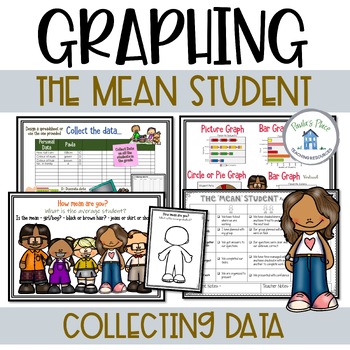
Graphing the Mean - Your students will experience a math task that will lead to a group presentation. They will compose questions, collect data, collate data, determine the ‘mean’, show the data in various graphs and design a poster to present the ‘mean student’.Slides include-What the unit will cover-How mean are you? What will you be looking for?-What is the mean?-How mean are you?-Template for recording the mean student-Ideas for recording data-Group guidelines – it’s your turn-Types of graph
Subjects:
Grades:
4th - 6th
Data Scavenger Hunt
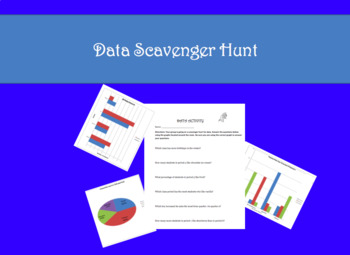
This activity has students look at questions and determine which graph will give them the information that they need. Great as a scavenger hunt activity. This activity forces students to read the title of the graph and interpret what they are reading.
Subjects:
Grades:
3rd - 7th
Types:
Representing Data - Charts and Tables Lesson
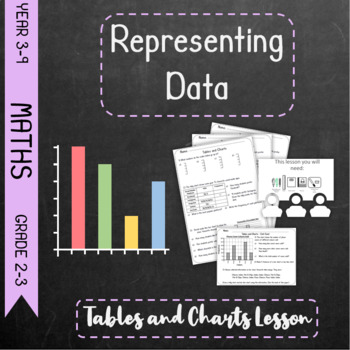
This resource consists of differentiated lessons, worksheets and print offs. The lessons are a set of 3 differentiations of the same lesson in PowerPoints form as well as a mixed version to allow you to differentiate on the fly. The worksheets are a set of 3 differentiations with some overlap in both PDF and PowerPoint form for easy editting. There is also an undifferentiated exit card for assessment purposes. This is a PDF.Finally there is a variety of print offs that can be used as lesson aids
Subjects:
Grades:
2nd - 9th
Also included in: *Bundle* Representing Data - Bar Charts and Tables *Bundle*
Bar graphs - Power Point presentation
This .ppt presentation is perfect for teachers who have students needing a refresher on bar graphs. It reviews the terminology of bar graphs (including broken bar graphs) and has students collect data in class and create a bar graph.
This is NOT a unit, assessment, or homework assignment.
This is in PPT Show format.
Other statistics PowerPoint lessons you may find useful:
Finding Mean Median Mode and Range Power Point Lesson
Basic standard deviation and distribution curves and statisti
Subjects:
Grades:
3rd - 7th
CCSS:

All of the Common Core Math Standards Checklists
This is a bundle of checklists for Math Common Core Standards for all of the grades (K-12) on an excel spreadsheet with 5 columns for data input. These standards are organized in their own sub-domains to coordinate lessons. Please see my free file for an example.
Subjects:
Grades:
K - 12th
Types:
Showing 1-24 of 62 results

