20 results
6th grade Common Core 3.MD.B.3 handouts
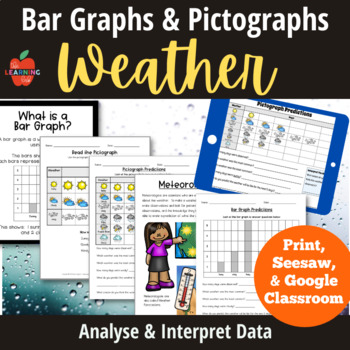
Weather NGSS ESS2: pictographs, bar graphs, forecasting, predictions, posters
Weather Bar Graphs and Pictographs for observing, analyzing and interpreting data! This package is both printable and digital (for Seesaw AND Google Classroom.) NGSS ESS2: Earth's Systems. Look at typical weather patterns, use data to make predictions, and consider connections to seasons!Printable 30 pages* Weather Forecast Worksheets (3 versions) *What is a Pictograph definition (2 versions) *Read the Pictographs worksheets *Meteorologist Fact Sheet (also with practice pictograph) *Pictograph P
Subjects:
Grades:
2nd - 6th
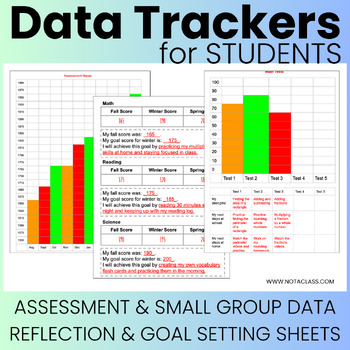
Data Trackers for Students - Printables for student data folders or binders
If you are looking for ways for students to track their iStation, I-Ready, NWEA MAP, unit tests, and any other district or state assessments then this product is for you. Reading bar graphs and organizing data are math standards in every state. So not only are students able to keep track of their data but they are learning or reviewing important math standards as well. All the pages are fully editable on PPT so that you can adjust them based on your students needs, scores and assessments. Whethe
Grades:
1st - 12th, Higher Education, Adult Education, Staff
Types:
Also included in: Data Trackers for Students and Teachers - Bundle | Editable
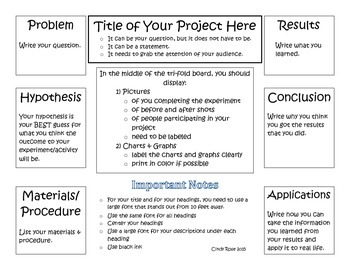
Science Fair Project Organizational Tools
Science Fair time means lot of questions from parents and students! These tools I've created will help to put you, your students, and your parents at ease by showing how to organize a successful science fair project! You will be able to use these handouts year after year!!
You will get a four page handout to give your students/parents that gives detailed page by page directions on how to organize the project notebook. The project notebook explains how to set up the report which includes the
Subjects:
Grades:
3rd - 6th
Types:
Bar Graph Template
Enjoy this bar graph template to kick start any bar graph unit with your students!Make sure to check out the data and graphing unit: Graphing Unit: Bar Graphs, Pictographs, Line Plots & Venn Diagrams
Grades:
1st - 12th
Types:
Zoo Field Trip Scavenger Hunt/ Graphic Activity
If you are looking for a fun way to make your Zoo Field Trip more exciting and meaningful, look no further. This no prep, easy to use, activity is perfect for students visiting your local Zoo. I have included a variety of animals and questions to spark their interest for them to get involved in their experience at the zoo. I also have a fun graphing activity for them to chart how many of each animal they observed.
Grades:
2nd - 6th
Types:
CCSS:
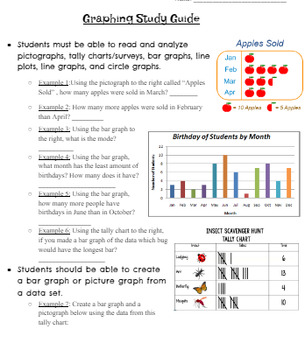
Graphing Unit Study Guide
This study guide outlines required graphing information for 3rd grade standards but also includes advanced graphing skills. It reviews pictographs, bar graphs, surveys/tally charts, line graphs, circle/pie graphs, line plots, probability, comparing two graphs, mean, median, mode, and range.
Subjects:
Grades:
2nd - 8th
Types:

Valentines Day Candy Graph | Collecting Data
Celebrate Valentines Day and reinforce graphing skills with this Valentines Day Graphing Activity! Students will use conversation hearts to fill out a graph and answer questions about their results. This product includes one graph that counts by 2's to represent how many of each color heart each student has. After coloring in their graph, students will answer five questions about the data they collected. There's also a mini activity explained on the data sheet where students can try to stack the
Subjects:
Grades:
3rd - 6th
Types:
CCSS:
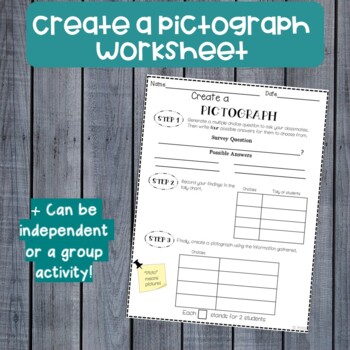
Create a Pictograph Worksheet
Here is a way for your kiddos to be creative and coming up with their own data! This gives them the chance to move around the room and practice their social skills! Your students can work independently or with partners on this handout!
Subjects:
Grades:
2nd - 8th
Types:
CCSS:
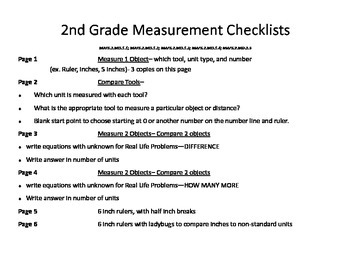
Grade 2 Hands on measurement checklist
This checklist includes a list of steps students would use to find the correct measurement tools, comparing tools, comparing lengths, and creating equations with unknown numbers. Each step from the Florida Common Core Standards is include in a student- friendly way to find the information needed for measurement comparisons. Also included are 6 inch rulers with the half inch pints marked, and 6 inch rulers with lady bugs to show comparison of non-standard with standard units.
Subjects:
Grades:
1st - 6th
Types:

Tables & Graphs Workbook - Grades K-6
Discover the world of Tables & Graphs with this workbook for grades K-6!
In this workbook, you'll find more than 50 pages of exercises to introduce and work on the Math Topic - Table & Graphs. Starting with learning to read different tables and graphs all the way to creating tables and graphs, this workbook provides a complete look and the topic and can be used with any grade level K-6.
Subjects:
Grades:
K - 6th
Types:
Bar Graph Worksheets
This packet allows for students to get practice analyzing, interpreting, and creating bar graphs. Each page comes with a key to make grading simplified. Please review this product and let me know what you think!
Grades:
1st - 8th
Types:
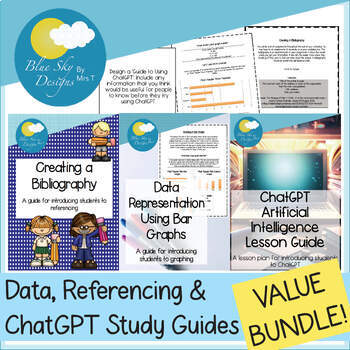
Data, Referencing and ChatGPT Study Guides VALUE BUNDLE
The study guides for creating bibliographies, creating bar graphs and navigating ChatGPT are now available together in one value bundle! Use this set of simple study guides to help your students practice their research skills, by guiding them through referencing, data representation and using artificial intelligence platforms like ChatGPT. What's IncludedCreating a Bibliography GuideUse this guide to help introduce your students to referencing through a bibliography. This resource has been creat
Subjects:
Grades:
3rd - 6th
Types:
CCSS:
Math Measurement Workbook
Student Workbook for telling time and measuring area.
This student workbook was created to follow the Math Makes Sense grade 4 measurement unit, but could be used to assist or give extra practice to students learning time and area. Includes a letter to parents explaining the unit and how they can assist their child.
Subjects:
Grades:
3rd - 6th
Types:
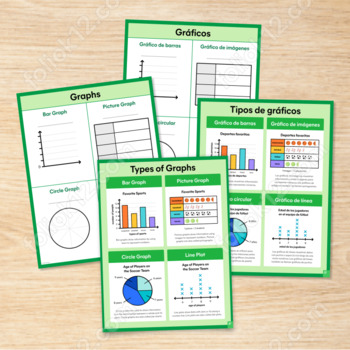
Types of Graphs Level 2 with Practice
Deepen your understanding of different types of graphs with this engaging resource, which includes Bar Graph, Picture Graph, Circle Graph, and an introduction to Line Plot. Students will learn how to represent quantified information and identify relationships, all within the exciting theme of sports. By connecting the graphs to real-life scenarios, learners can make meaningful connections and apply their newfound knowledge to other concepts. To reinforce graphing skills, use this aligned open-en
Grades:
3rd - 8th
Types:
CCSS:
Also included in: 3rd Grade Math!
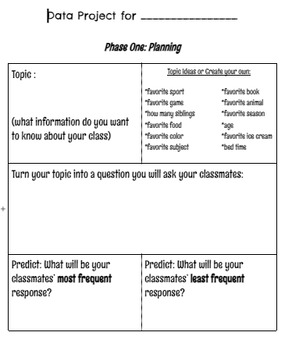
Graphing Project
This is a project that takes students through the stages of planning, data collection, graphing, and interpreting the graph. Students can come up with their idea for their graph and survey their class to come up with the data.
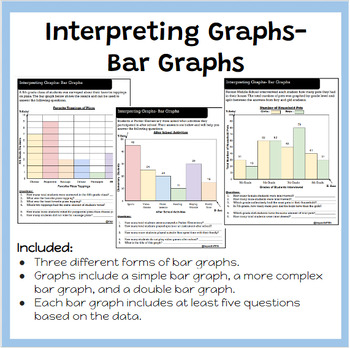
Interpreting Graphs- Bar Graphs
INCLUDES:Three different forms of bar graphs.Graphs include a simple bar graph, a more complex bar graph, and a double bar graph.Each bar graph includes at least five questions based on the data.
Subjects:
Grades:
3rd - 6th
CCSS:

Valentine's Day Picture Graph Activity (With Scaled Graph Option)
Practice collecting data on Valentine's Day and interpreting graphs or scaled graphs.
Subjects:
Grades:
PreK - 6th
Types:

Math Talk: Graphing Edition - Different Kinds of Graphs
This document can be used as a reference resource for students or put together to create a giant classroom poster. This file includes pictures and definitions of the following kinds of graphs:PictographBar GraphHistogramStem & LeafCircle
Subjects:
Grades:
3rd - 6th
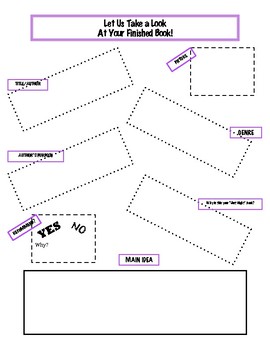
Let Us Take a Look At Your Finished Book!
This is a quick way for readers to share about the book they just read. I posted them on a bulletin board so other readers could get recommendations.
Subjects:
Grades:
K - 8th

Data Analysis Recording Sheet
Students can record minimum, maximum, range, median, mode, and mean for 4 different data sets. I've included tricks for each of the words as a tool when they are analyzing data!!
Showing 1-20 of 20 results

