7 results
6th grade Common Core 3.MD.B.3 classroom forms
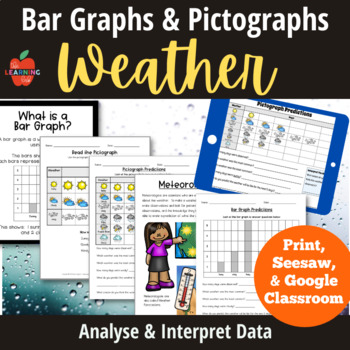
Weather NGSS ESS2: pictographs, bar graphs, forecasting, predictions, posters
Weather Bar Graphs and Pictographs for observing, analyzing and interpreting data! This package is both printable and digital (for Seesaw AND Google Classroom.) NGSS ESS2: Earth's Systems. Look at typical weather patterns, use data to make predictions, and consider connections to seasons!Printable 30 pages* Weather Forecast Worksheets (3 versions) *What is a Pictograph definition (2 versions) *Read the Pictographs worksheets *Meteorologist Fact Sheet (also with practice pictograph) *Pictograph P
Subjects:
Grades:
2nd - 6th
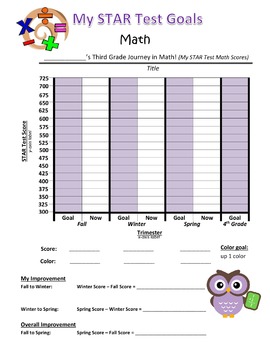
My STAR Test Goals - Student goal setting for standardized tests
This is a fully editable .DOC file that I have used to help my students set goals for their STAR test throughout the school year.
As a bonus, students can practice their measurement & data skills.
I have used this in a whole group setting, making an anchor chart with good test taking practices in order to help students brainstorm for the "two things I will do to reach my goal". I have also used this leading up to their STAR test and post STAR test during individual student conferencing.
Subjects:
Grades:
3rd - 8th
Types:
CCSS:
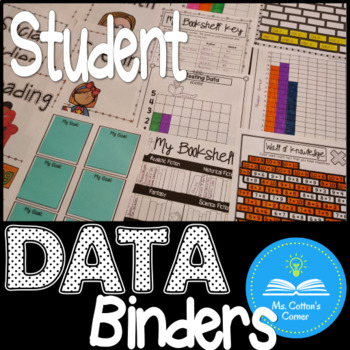
Student Data Binder - SMART Goals, Conference Forms, Reading log and more
Are you looking for a resource that will help your students set goals, track progress and take ownership in their learning? This resource includes over 100 SMART goal setting sheets, data tracking sheets, reading logs and other helpful printables that will make Parent-Teacher Conferences a breeze! Everything you need to bring data binders to your classroom is included. There are multiple options for each subject area, allowing you and your students to create the data binders that work for yo
Grades:
3rd - 6th
NGSS:
MS-LS1-5
, MS-ESS1-4
, 5-ESS2-2
, 4-PS4-2
, MS-ESS2-3
...
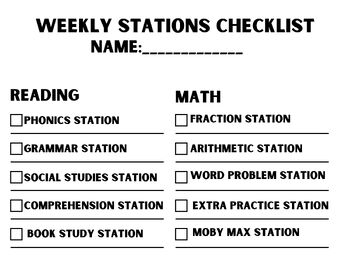
Reading and Math Centers, Small Group, Stations Checklist
Introducing our Weekly Math and Reading Stations Checklist – a versatile and dynamic tool designed to revolutionize learning in classrooms from Kindergarten to 6th grade. This comprehensive checklist is the perfect solution for educators seeking an organized approach to managing stations, centers, and small group activities while holding students accountable for their assignments.Key Features:All-in-One Solution: Streamline your weekly planning with this all-encompassing checklist that seamlessl
Subjects:
Grades:
1st - 6th
Science Fair board graphic organizer and guide, google slides, low ink
A science fair project journal can be helpful in several ways:Organizing thoughts and ideas: The journal can help you to organize your thoughts and ideas as you plan, conduct and reflect on your experiment.Recording observations and data: It can serve as a record of your observations and data throughout the project, which can be useful in analyzing and interpreting results.Maintaining a timeline: The journal can also serve as a timeline of your project, allowing you to track your progress and ma
Subjects:
Grades:
2nd - 9th
CCSS:
NGSS:
3-5-ETS1-3
, 3-5-ETS1-1
, 3-5-ETS1-2
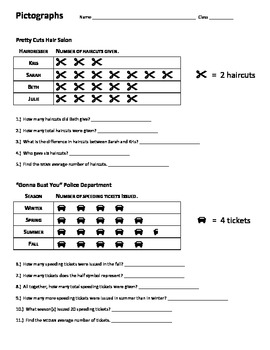
Creating and Interpreting Pictographs
Students will use this worksheet to practice interpret and create different pictographs.
Front Side:
Two pictographs have been created and keys provided. Students must use the key to answer a variety of questions. Among those questions will be finding the mean and median.
Back Side:
Students must use a table of information to create two different pictographs.
This work is licensed under a Creative Commons Attribution-NonCommercial-NoDerivs 3.0 Unported License.
Subjects:
Grades:
3rd - 6th
CCSS:
Bar Graph Grade Tracker
Students graph their scores for assignments, test, etc. (as directed by the teacher). Each student receiver a tracker for their graph and writes the subject, labels for each axis, scale for the y-axis, and assignment titles/descriptions for the x-axis. Students have the opportunity to take ownership and responsibility for their results, reflect on learning and performance, practice graphing, and integrate math skills into other subjects.
Subjects:
Grades:
3rd - 6th
CCSS:
Showing 1-7 of 7 results


