Types of Graphs Level 2 with Practice
Also included in
- This 3rd grade math bundle offers a comprehensive collection of resources to enhance learning in several topics, including Fact Families for multiplication and division, Types of Graphs, Place Value to Thousands, Rounding to the Nearest 10 and 100 on both standard and metric units, and Fractions, amPrice $24.30Original Price $27.00Save $2.70
Description
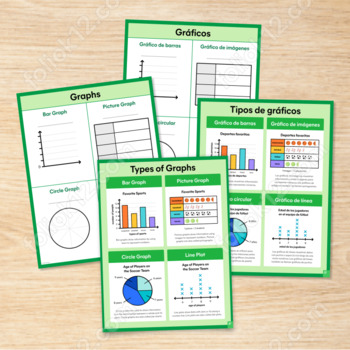
Deepen your understanding of different types of graphs with this engaging resource, which includes Bar Graph, Picture Graph, Circle Graph, and an introduction to Line Plot.
Students will learn how to represent quantified information and identify relationships, all within the exciting theme of sports. By connecting the graphs to real-life scenarios, learners can make meaningful connections and apply their newfound knowledge to other concepts. To reinforce graphing skills, use this aligned open-ended resource with the practice companion piece.
This student-centered template allows learners to practice and apply their graphing skills using consistent graph templates, including bar graph, picture graph, circle graph, and line plot. Together, these resources offer both practice and assessment opportunities, and learners can use the connected illustrations as models to create their graphs.
These resources are available in Spanish variants!


