25 results
Adult education Common Core 3.MD.B.3 resources
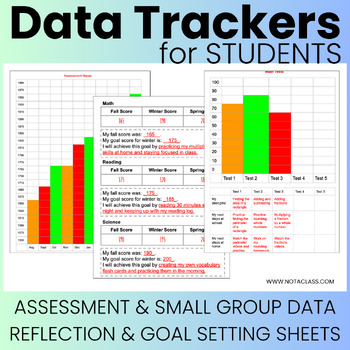
Data Trackers for Students - Printables for student data folders or binders
If you are looking for ways for students to track their iStation, I-Ready, NWEA MAP, unit tests, and any other district or state assessments then this product is for you. Reading bar graphs and organizing data are math standards in every state. So not only are students able to keep track of their data but they are learning or reviewing important math standards as well. All the pages are fully editable on PPT so that you can adjust them based on your students needs, scores and assessments. Whethe
Grades:
1st - 12th, Higher Education, Adult Education, Staff
Types:
Also included in: Data Trackers for Students and Teachers - Bundle | Editable
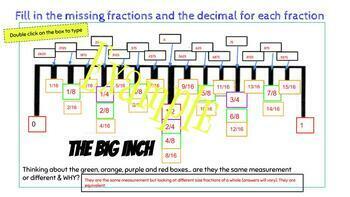
Measurement Galore - Reading a Tape Measure
This product come from struggling to teach students how to use the measuring tape and how to understand the fractions on a measuring tape. It has multiple representations of reading fractions on a measuring tape and fraction bar. It has spaces to type in answers and printable test pages to assess learning. It shows multiple ways to represent the same fraction (equivalent fractions). It is fun, yet rigorous. I included websites where your students can go to play online measurement games and vi
Grades:
3rd - 12th, Higher Education, Adult Education
Types:
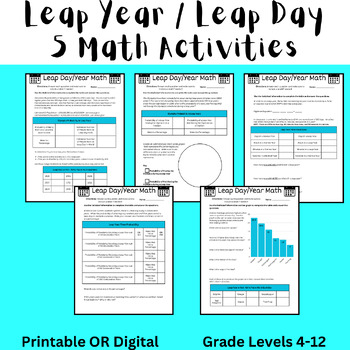
Leap Day (Leap Year) 2024 Math Activity (Algebra and Data) Digital or Printable
These 5 activities are fun NO PREP math activities to do to celebrate Leap Day 2024 (Leap Year 2024). The activities can be completed as 5 separate pages or as a 5 page packet. There is a customizable digital resource (Google Document) and a printable resource (Canva) that contain the same directions and activity. This was designed for students in middle school, but could be used for upper elementary and high school students in Pre Algebra, Pre-Algebra, or Algebra. In this assignment, students
Subjects:
Grades:
4th - 12th, Higher Education, Adult Education
Types:
Also included in: Leap Year (Leap Day) 2024 Bundle - Math, Reading, Writing, and Trivia
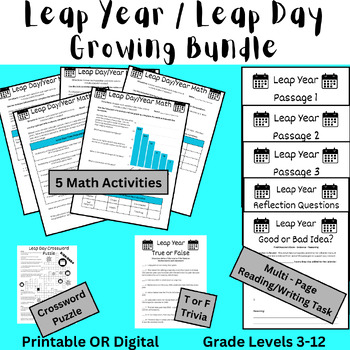
Leap Year (Leap Day) 2024 Bundle - Math, Reading, Writing, and Trivia
This bundle contains several fun and NO PREP activities to use to celebrate Leap Day 2024 (Leap Year 2024). Many contain a customizable digital resource (Google Document) and a printable resource (Canva) that contain the same directions and activity. These activities were designed for students in middle school, but could be used for upper elementary and high school students in Pre Algebra, Pre-Algebra, or Algebra.For more details on each product, click on the individual product to see the previe
Subjects:
Grades:
4th - 10th, Higher Education, Adult Education
Types:
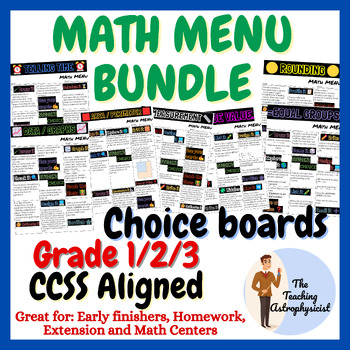
Math Menus Grade 1/2/3 | Enrichment | Choice menu | Printable Offline Version
This set of 28 Math Menus provide students with engaging and varied activities related to 1st, 2nd and 3rd grade math concepts and skills. These math menus are meant to support independent work for early finishers, homework options, math center work or as an extension activity.The math menus are perfect for differentiation on the fly and to support fast students and those that need a variety of tasks to support their learning. Task templates are included to support student learning, which are ea
Subjects:
Grades:
K - 4th, Adult Education
Types:
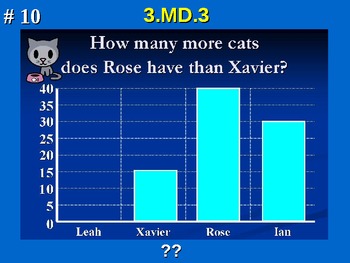
3rd Grade Common Core Math 3.MD.3 Measurement and Data
Third Grade Common Core Math 3 MD.3 Measurement and Data Practice provides two ways for students to practice and show mastery of their measurement skills.
It includes 40 distinct problems in two sets (129 slides in all!), with and without following answer slides. The PowerPoint file can be used on computers, or Promethean and Smart boards.
Take a look at the preview file and buy today for your students benefit!
3.MD.3 Represent and interpret data.
3. Draw a scaled picture graph and a scal
Subjects:
Grades:
3rd, Adult Education
CCSS:
Also included in: 3.MD.3 3rd Grade Math - Draw Scaled Picture & Bar Graph Bundle w/ Google
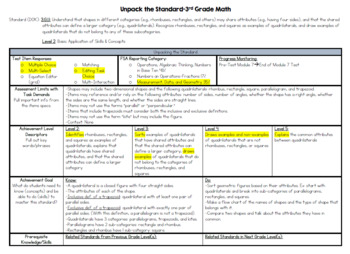
3rd Grade Math | Unpacking the Standard | Planning Tool
This resource is a great planning tool to dive deeper into the 3rd Grade Math Standards! This bundle of Unpack the Standards includes majority of the 3rd Grade Math Standards. See below for the full list!The products included in this bundle make it easier to understand what is required of the students so you know how to best teach the standard in its entirety. Each standard includes an unpacking, which consists of the following:the standard written outitem specificationstest response itemsachiev
Subjects:
Grades:
3rd, Adult Education, Staff
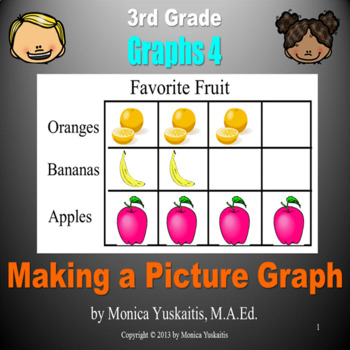
3rd Grade Graphs 4 - Making a Picture Graph Powerpoint Lesson
Third Grade Graphs 4 - Making Picture Graphs - This is perfect for distance learning on Zoom or similar formats. On top of that it is powerful when used as direct instruction in the classroom. It teaches students how to make a picture graph. In addition, the main parts of the picture graph are also taught. The following concepts are reviewed: grid, graph, coordinates, axes, scale, interval, title, and key. There are 22 strategies of effective teaching based on research in this powerpoint les
Subjects:
Grades:
3rd - 4th, Adult Education
CCSS:
Also included in: 3rd Grade Graphs Bundle - 6 Powerpoint Lessons - 277 Slides
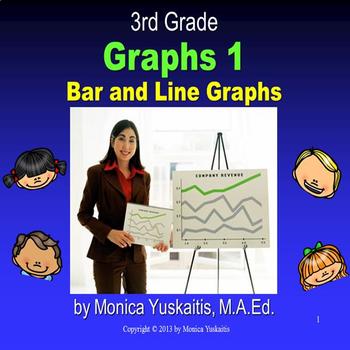
3rd Grade Graphs 1 - Bar & Line Graphs Powerpoint Lesson
Third Grade Graphs 1 - Bar & Line Graphs introduces the students to graphs in general and emphasizes bar and line graphs. This is perfect for distance learning on Zoom or similar formats. On top of that it is powerful when used as direct instruction in the classroom. The following concepts are taught: grid, graph, coordinates, axes, scale, interval, title, key and how to solve problems using a bar or line graph. This lesson is based on 22 principles of effective teaching based on resear
Subjects:
Grades:
3rd - 5th, Adult Education
CCSS:
Also included in: 3rd Grade Graphs Bundle - 6 Powerpoint Lessons - 277 Slides
6 Editable Bar Graph Templates 2.0
Finally a simple and professional graph space that students can fill out without any design issues getting in the way. This file contains 6 ready-to-use graph options. Print them and have students fill them with pencil and ruler, or distribute them over computer and let them practice entering the data. Get a project perfect finish every time. Maybe you just want to fill it out live on a projector? The possibilities are endless! It's okay to say you love these bar graphs. So do we.Contains:- 2 bl
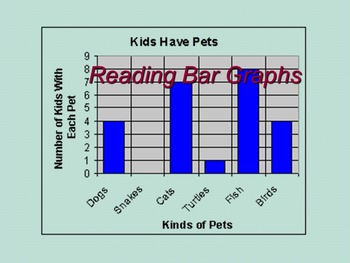
Reading a Bar Graph: meeting the Common Core.
Here is an activity to challenge your students into a higher thinking level from the traditional basics. “Reading a Bar Graph” will introduce your student into interpreting graphs using a step by step guide. “Reading a Bar Graph” will present the teacher with an option of introducing their students to interpret these graphs by applying a step by step a power point format or PDF format.
Use the step by step power point guide on a smart board, overhead projection system, or board & wo
Subjects:
Grades:
2nd - 12th, Adult Education
Types:
Living and Nonliving Things Science Vocabulary Bingo Activity
This is a Science Activity Lesson based on the Science Standard about Living and Nonliving Things. It also ties in with Math Standards regarding creating and reading bar graphs and number lines. While that standard pertains to 3rd grade many other grades need to review and reteach it to help students. This activity helps ESL students and others to master the vocabulary for the science standard as well. This activity is a DOK level 2 and 4 but is not complicated. It will take 3 days and all paper
Subjects:
Grades:
3rd - 11th, Adult Education
Types:
CCSS:
3.MD.3 3rd Grade Math - Draw Scaled Picture & Bar Graph Bundle w/ Google
3.MD.3 3rd Grade Math - Draw Scaled Picture & Bar Graph Bundle w/ Google Practice provides two ways for students to practice and show mastery of their measurement skills.This bundle provides both my original PowerPoint and the new Google Slide Set products for a low upgrade fee! It includes 40 distinct problems in two sets (129 slides in all!), with and without following answer slides. The PowerPoint and Google Slide Set can be used on computers, or Promethean and Smart boards or shared with
Subjects:
Grades:
3rd, Adult Education
CCSS:
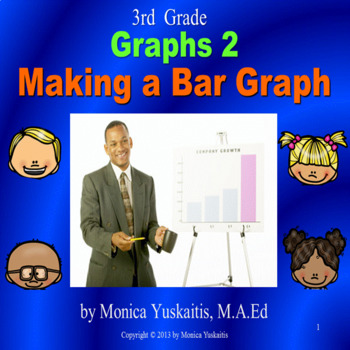
3rd Grade Graphs 2 - Making Bar Graphs Powerpoint Lesson
Third Grade Graphs 2 Making Bar Graphs - This is perfect for distance learning on Zoom or similar formats. On top of that it is powerful when used as direct instruction in the classroom. It teaches students how to make bar graphs. The following concepts are reviewed: grid, graph, coordinates, axes, scale, interval, title, and key. There are 22 strategies of effective teaching based on research in this powerpoint lesson. For best results, students should have white boards and dry erase mar
Subjects:
Grades:
3rd - 4th, Adult Education
CCSS:
Also included in: 3rd Grade Graphs Bundle - 6 Powerpoint Lessons - 277 Slides
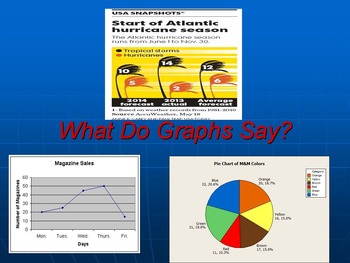
What Do Graphs Say?
This set of 20 activities will answer the question “What do graphs say?”. Challenge your students to analyze graphics and respond to given questions will improve their problem solving skills.
Teachers may use this packet as a cooperative group lesson, assigned homework, board work, after student completion of assignment activity, and many others.
Common core standards that will be met in this activity include CCSS. math content .3MD.B.3 and 3MD.B.4.
Presented in PDF or Power Point
Subjects:
Grades:
3rd - 12th, Adult Education
Types:
3.MD.3 3rd Grade Math - Draw Scaled Picture & Bar Graph Google Slide Set
3.MD.3 3rd Grade Math - Draw Scaled Picture & Bar Graph Google Slide Set Practice provides two ways for students to practice and show mastery of their measurement skills.It includes 40 distinct problems in two sets (129 slides in all!), with and without following answer slides. This Google Slide Set can be used on computers, or Promethean Activboard, Smart boards and in Google Classroom TM. Take a look at the preview file and buy today for your students benefit!3.MD.3 Represent and interpre
Subjects:
Grades:
3rd, Adult Education
Types:
CCSS:
Also included in: 3.MD.3 3rd Grade Math - Draw Scaled Picture & Bar Graph Bundle w/ Google
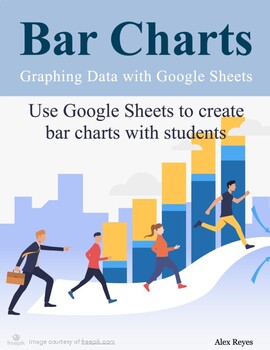
Google Sheets Bar Charts (Distance Learning)
Create bar charts using Google Sheets. Learn how to format the bar charts to represent information and trends. Create stacked and horizontal bar charts. Get a copy of the data in the lessons so you can follow along. Learn to publish charts using Docs, Slides, Sheets, or Sites.
Subjects:
Grades:
2nd - 12th, Higher Education, Adult Education, Staff
Types:
CCSS:
Learn about Learning AND Math... Growth Mindset, Brain Based, Grit
Practice math and learn about learning, simultaneously. These activities engage your students to use their math skills, analyze real data, learn about the learning process, and reflect their learning. Bundle includes lessons on: Brain Based LearningGrowth Mindset Grit and Productive StruggleRetrieval PracticeMath Skills Include: RatiosFractionsPercentsGraphsIntegersNumber LinesGrowth Mindset Introduce decimals (or fractions! integers! the math of your choice!) and discuss growth mindsets with
Subjects:
Grades:
5th - 9th, Higher Education, Adult Education
Types:
CCSS:
3rd Grade Math - Interpret & Represent Data
Each Cohesion Education video has been designed by teachers for parents! All videos include:A Breakdown of the concept being taughtA How-To section in which the concept is modeled similar to the classroomA Student Misconceptions section where we dispel some of those common problems students encounterNext Steps for practical reinforcement of the concept either with a parent or teacherWant to do more than just watch our videos?With a teacher subscription to our full video library a teacher can:Inv
Subjects:
Grades:
3rd, Adult Education
Homework Habit Builder: Check In | Reflection | Math w. Sticky Note Graphs
Are your students studying at home? How frequently? Do you know? Do they? Use the power of the humble sticky note, and a few good questions to gather answers, reflect on progress and nudge all students towards more regular homework/independent studying. About: Gather quick and anonymous data about homework habitsUse social norming to encourage students to improve their homeworkReflect on progress and set goalsPractice math skills with personally relevant dataMath optional; adapt reflection to an
Subjects:
Grades:
8th - 12th, Higher Education, Adult Education
Also included in: Homework Habits Bundle: 4 Resources + Month by Month Plan
3:25
Interpret and Create Picture Graphs
A picture graph (also called a pictograph) uses small images to organize and compare data. Students will both create and read picture graphs to answer questions. Students must read the key first when reading a picture graph.How do we create and read a picture graph?Each Cohesion Education video has been designed by teachers for parents! All videos include:A Breakdown of the concept being taughtA How-To section in which the concept is modeled similar to the classroomA Student Misconceptions secti
Subjects:
Grades:
3rd, Adult Education
CCSS:
Also included in: 3rd Grade Math - Interpret & Represent Data
3:14
Use a Frequency Table to Solve Problems
A frequency table represents the data from a tally chart or other data sources in numbers. Students use frequency tables when problem solving because it makes it easier to pull out the numbers being added or subtracted. Students must convert other forms of data to a frequency table, and be able to use the numbers to calculate.How do we transfer other forms of data to a frequency table?Each Cohesion Education video has been designed by teachers for parents! All videos include:A Breakdown of the c
Subjects:
Grades:
3rd, Adult Education
CCSS:
Also included in: 3rd Grade Math - Interpret & Represent Data
3:52
Interpret and Create Bar Graphs
Bar graphs are used to organize and compare data. Students will both create and read them, paying close attention to components such as the title, scale, and labels for both axes.How do the main parts of a bar graph help us read the data?Each Cohesion Education video has been designed by teachers for parents! All videos include:A Breakdown of the concept being taughtA How-To section in which the concept is modeled similar to the classroomA Student Misconceptions section where we dispel some of t
Subjects:
Grades:
3rd, Adult Education
CCSS:
Also included in: 3rd Grade Math - Interpret & Represent Data

Distance Learning K-6 Math Game App (Support IOS & Android)- Covid FREE Software
[Covid19 Notice: We want to do our part and give back to the community during this trying time. And we are making the app completely FREE$̶1̶9̶.̶9̶0̶ for School year 2020. Just claim this free app and let the fun begin! And please leave 5-Stars review ⭐⭐⭐⭐⭐ if you find it useful. Thanks]NImbleArt Zapzapmath-School teaches math in a fun, visual and interactive way. And, teachers will be able to check on student’s progress via a Web Dashboard. Let’s see what else are added to the equation: Access
Grades:
PreK - 6th, Adult Education, Staff
Showing 1-24 of 25 results

