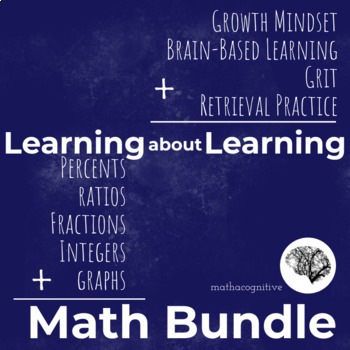
Learn about Learning AND Math... Growth Mindset, Brain Based, Grit
- Zip
- Easel Activity
Products in this Bundle (4)
Description
Practice math and learn about learning, simultaneously.
These activities engage your students to use their math skills, analyze real data, learn about the learning process, and reflect their learning.
Bundle includes lessons on:
Brain Based Learning
Growth Mindset
Grit and Productive Struggle
Retrieval Practice
Math Skills Include:
Ratios
Fractions
Percents
Graphs
Integers
Number Lines
Introduce decimals (or fractions! integers! the math of your choice!) and discuss growth mindsets with these numberline-based assessments.
This resource includes facilitation notes, ready-to-print student handouts, and customizable materials.
Included:
- 10 growth mindset assessment variations
- Two sets of prompts to focus on attitudes about learning math, or a more general discussion
- Four number line variations: Decimals, Fractions (two versions, both use eighths, quarters and halves), signed numbers
- Customizable (blank) number lines to adapt or expand
- Mindset Tally Sheet (optional follow up using addition/subtraction skills)
- 5 math adaptation and expansion ideas
- Procedures for recommended facilitation
- Links to growth mindset resources for further discussion
- College and Career Readiness Standards for Adult Education
Help your students learn about effective study strategies, reflect on their own habits, and do some math at the same time.
Use online resources (linked in the document) to learn about brain-based and research backed strategies, then help your students collect data on which of six scientifically backed learning strategies they use with the included tally sheets.
Add an analysis task that suits your class and curriculum: Find the perfect or fraction of the class who give each answer, the ratio of those who do or don't, or graph the results.
I've seen too many students get stuck, struggling with math (and math anxiety) unsure how to proceed. Help them identify proactive strategies *before* they get stuck, and build a culture of grit and resilience.
Brainstorm strategies, gather authentic data, analyze using one of four math skills. (Fractions, ratios, percents, graphs)
File includes: Lesson plan (with standards and procedures), extension ideas, multiple data collection variations, and student handouts for: fractions, ratios, percents, and bar graphs.
Retrieval practice is shown to boost student learning, and is an easy study strategy for busy adults to implement. Done in class, it also gives teachers great formative insights.
In this lesson students explore retrieval practice, and strengthen their math skills by gathering and analyzing real data at the same time
This lesson includes everything you need to:
- Introduce retrieval practice
- Engage students in free recall (an activator and reflection for them, a formative assessment for you)
- Analyze authentic data about their own learning. (Using the math skill that suits your class)
It includes materials for ratios, fractions, or percents, so you can choose the math that suits your students. Three different handouts, with variations (7 in total) and 10 extension ideas to continue your students' learning.
Designed with adult learners (HISET/GED/ABE/ASE/TASC) in mind.
Let’s Connect! Blog |Facebook |Twitter | Pinterest


