50 results
7th grade statistics song activboard activities
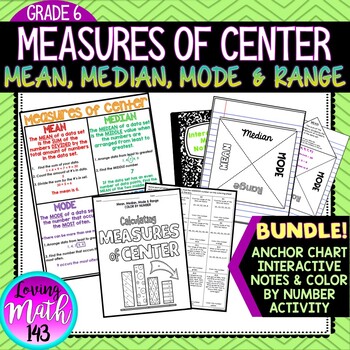
Mean Median Mode and Range Interactive Notes, Poster and Activity BUNDLE
Mean, Median, Mode & Range Color By Number ActivityThis color by number activity is a fun and engaging way for students to practice calculating the measures of center including mean, median, mode and range. Students will solve 16 questions involving mean, median mode, and range then find their answer on the color by number sheet. If their answer is not on the color by number then their answer is not correct. This activity is aligned with the sixth (6th) grade common core standards.WHATS INCL
Subjects:
Grades:
5th - 8th
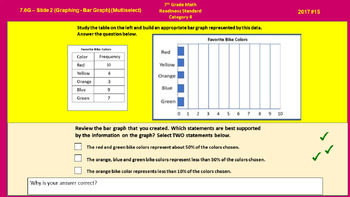
Math Jam Interactive Slides - 7th Grade Cate 4
Jamboard slides aligned to Math STAAR Release problems and new items types that include Equation Editor, Text Entry, Graphing, Number Line, Hot Spot, Fraction Model, Drag n Drop, Match Table Grid and Multiselect. Resource can be used to expose students to the new item types on the STAAR Redesign math assessment.
Subjects:
Grades:
7th
Categorical Data vs Numerical Data Flip Chart
In this flip chart, students will learn the difference between categorical data and numerical data, examples, and key vocabulary. The activinspire flip chart allows the teacher to reveal the information by removing the shapes over the correct information. At the end of the lesson are five questions which the students have to classify as categorical or numerical.
Grades:
5th - 8th
Types:
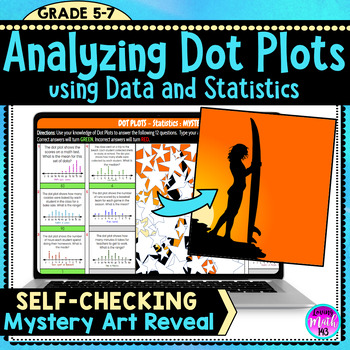
Analyzing Dot Plots using Data and Statistics Fun Digital Mystery Art Reveal
This Digital Self-Checking Math Activity allows middle school students to practice analyzing dot plots using data and statistics. Students will apply their understanding of line plots, mean, median, mode and range. Each correct will reveal part of a fun Mystery Picture! Great resource as independent practice or homework.This is a perfect activity to check for understanding of probability and statistics during distance learning and students using Google Classroom™. You can share this activity wit
Subjects:
Grades:
6th - 7th
Mean Median Mode Magic: BUNDLE
Teaching Mean, Median, Mode, and Range can be fun, memorable, and exciting with these unforgettable engaging activities. I've bundled several of my most popular data activities in this bundle, plus added many more.Two song lyrics have been included. Helpful hints have been add to the printables. This pack is sure to bring a little magic into to your classroom!
Included in this pack:
Bubblegum Data
Smartie Data
MINUTE to WIN IT:
Two generic data sheets are included to be added to most Minute
Subjects:
Grades:
4th - 7th
Types:
Fundamental Counting Principle and Probability Powerpoint
This 22 slide powerpoint is a great way to teach Tree Diagrams, The Fundamental Counting Principle, and Probability to your Middle Schools Students. It can be used with a smartboard to get your students active and involved or without a smartboard.
Subjects:
Grades:
6th - 8th, Adult Education
Math Songs
This collection of 5 songs helps students remember key math concepts. The songs focus on the concepts order of operation, place value, long division, line geometry, and data (mode, median, and mean). All songs are sung to familiar tunes and are parodies of popular songs. Students love singing the songs and easily remember the concepts with these powerful mnemonic devices!
All the lyrics in this collection are original and written by Alexis Sergi (Math Mojo). I hope your students enjoy them!
Subjects:
Grades:
2nd - 10th
Types:
Which Graph Do I Use to Display Data? Flip Chart
This review of various graphs indicates which graph is best to use for certain types of data. At the end, there is a 10 question multiple choice activote activity where the students are given a situation and have to choose the correct graph to display their data.
Subjects:
Grades:
4th - 8th
Types:
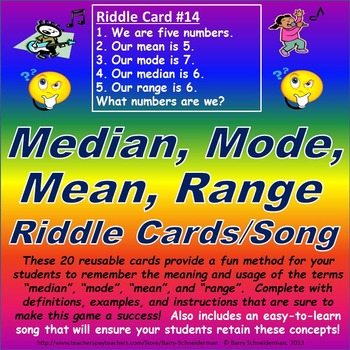
Median, Mode, Mean, Range Riddle Card Challenge (Song Included!)
This product is a must for the beginning of the year (to be reused at any point during the year) for any late elementary or middle school classroom. It is the ultimate remedy for the “Wait a minute; which one was the middle number again, mean or median?” scenario. This product is identical to the Median, Mode, Mean, Range Riddle Card Challenge! product, but also includes the lyrics, sheet music, and video file for the original "Medmid-momo-meav-rabism" song, a true crowd favorite with elementa
Subjects:
Grades:
4th - 7th
Types:
"Lollipop" STATISTICS
CANDY and MUSIC, what a great way to get kids motivated about MATHMATICS! I have used this lesson in my middle school class room for many years with great success. Middle school tasks should be meaningful and relevant; this lesson is that and more. Students must work directly with data in order to understand the fundamentals of statistical ideas. This lesson will catch the attention of students with varying abilities in a non-threatening approach.
The lesson offers 10 steps to thoroughly engag
Subjects:
Grades:
5th - 10th
Math Escape Room For 11th and 12th Grade
If you are looking for a Math detective based team-building activity challenge to keep your students engaged with revision and learning about this topic, then this EDUCATIONAL ESCAPE ROOM is for you! There are seven detective inspired - but subject themed (trivia) challenges included in this file. Students will complete a variety of tasks using different skills including: problem-solving, critical thinking, reading comprehension, literacy challenges and some clever deduction. The puzzles, bonus
Subjects:
Grades:
7th - 12th
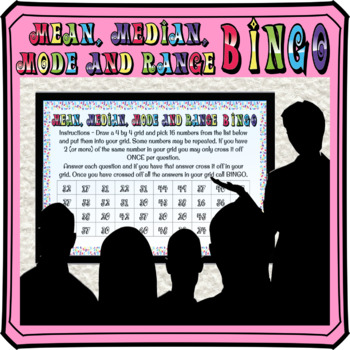
Mean, Median, Mode and Range math BINGO
This mean, median, mode and range activity is a really fun way for students to practice. Skills include finding the mean, median, mode or range from a list of numbers. All give positive integer answers.Show the questions on a Smart Board or projector. Your students will love it and won't realize how many questions they are answering!This product includes:★ A PowerPoint display with instructions, student choice bingo numbers and 40 questions★All 40 numbers on screen for students to make their own
Subjects:
Grades:
5th - 8th
Mean, Median, Mode - Music Video - Math Song
"Your Average Joe" is a four minute, karaoke style music video, that students can sing along with to help learn about the 3 kinds of averages. It introduces how to find the mean, median, and mode.
The song is done in a sort of "country rap" type style. This would make a good introduction to, or review for the concept of averages.
The video integrates music, math, reading, and animation. You can use it as daily practice, part of a lesson, review of the steps, PE warmup, clean-up song, or ju
Subjects:
Grades:
4th - 7th
Types:
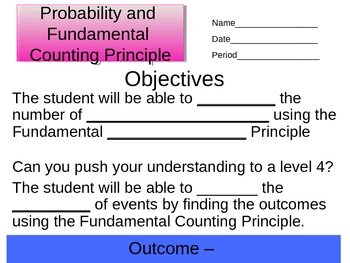
Fundamental Counting Principle and Probability Student Notes Powerpoint
This 18 slide powerpoint goes with my Fundamental Counting Principle, and Probability Powerpoint. You can print a handout of these slides with the blanked out key information for students to use to take notes as they follow along with the presentation.
Subjects:
Grades:
6th - 8th, Adult Education
Probability Math Escape Room
This Math Escape Room themed on Probability covers key concepts relating to this topic such as Outcome, Impossible, Evens, Fractions, percentages and more! Escape Room is suitable for High School Math or Science students (Physics, Chemistry, Biology or Earth Sciences).Product contents:☞ Escape Room Interactive Tracker PowerPoint - Keeps the competitive nature on display☞ Escape Room Puzzle Keys (Six Sets for Six Teams)☞ Escape Room Team sheet - Record codes, answers clues as they progress throug
Subjects:
Grades:
7th - 11th
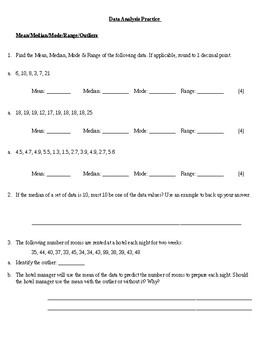
Data Analysis Practice (Mean, Median, Mode, Outliers, Graphing)
Worksheet practicing skills such as:
- Calculating Mean, Median, Mode, Range, Outliers
- Choosing the best graph/measure of central tendency
- Drawing & Analyzing Circe Grapgs
Subjects:
Grades:
5th - 9th
Statistical Questions Interactive Presentation - 6.SP.1
Interactive Powerpoint will provide students with definitions, opportunities to differentiate between statistical questions and non-statistical questions and the ability to write statistical questions. The lesson moves step by step through the material in a way that will keep students interested and provide a basis for future learning. Use with smartboard, projector, computer, pad or as printables. Great lesson for cooperative learning or centers.
Objectives:
- Recognize statistical questions
Subjects:
Grades:
5th - 8th
CCSS:
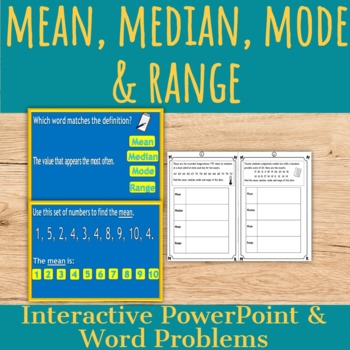
Mean, Median, Mode & Range: Word Problems and PowerPoint
This is a powerpoint activity which includes definitions and examples of mean, median, mode and range followed by an interactive multiple choice quiz.Also included is a worksheet pack of twelve word problems which could be used as a follow up activity. Each problem asks for the calculation of the mean, median, mode and range.
Subjects:
Grades:
5th - 7th
CCSS:
Also included in: 6th Grade Math Bundle
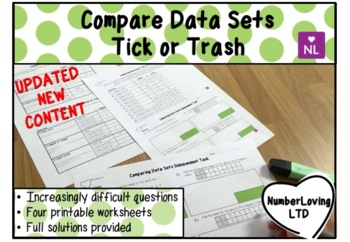
Comparing Data Sets (Tick or Trash)
Test your students' ability to spot mistakes and develop their understanding with this activity. Pupils are given two different answers to a question and have to determine which is correct. They then have to explain what misconception has led to the incorrect answer. This resource covers the topic of comparing data represented in lists using mode, median, mean and range, and interquartile ranges. There are three tick or trash worksheets and one independent extension task. The four worksheets in
Subjects:
Grades:
7th - 10th
Also included in: BUNDLE Tick or Trash Worksheets
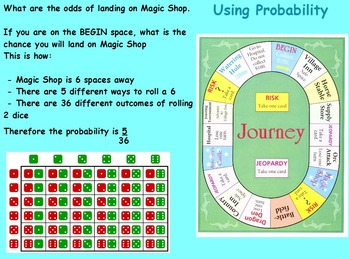
Probability - Playing a Board Game (SMART BOARD)
This document presents a tutorial on comprehending the concept of PROBABILITY in relation to playing a board game. It aims to provide a fundamental understanding of probability and includes a few inquiries to assess comprehension. Additionally, the material is aligned with state standards and objectives and includes a pre-class poll to gauge prior knowledge. The lesson utilizes engaging visuals and informative descriptions to captivate students of varying abilities. Its design ensures that all s
Grades:
6th - 8th
Statistics Math Escape Room (Team Building & Problem Solving in Math)
This Math Escape Room themed on Statistics covers key concepts relating to this topic such as Medium, Mode, Mean, Range and more! This Escape Room can be used for High School Math, Statistics or Science students (Physics, Chemistry, Biology or Earth Sciences).How can this resource be adapted for social distancing?Upload / send the sheets digitally so students who can work independently through them (don’t use the keys or PPT tracker if so)Could use as part of a Recovery CurriculumSet the 7 Puzzl
Subjects:
Grades:
7th - 12th
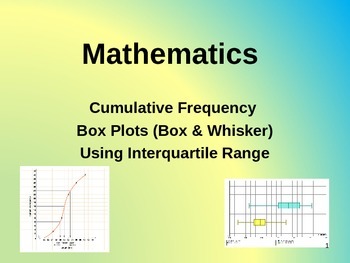
CUMULATIVE FREQUENCY, BOX PLOTS (BOX & WHISKER DIAGRAMS) & INTERQUARTILE RANGE
This lesson looks at plotting cumulative frequency curves from tables and using box plots (box and whisker diagrams) to analyse the data from these. Interquartile range is also included/ explored. This lesson aims to show learners how to draw and understand cumulative curves in a step-by-step way that is both visual and interactive, with questions and answers included. This also reduces the need for printing and makes good, printable revision notes. This resource will prove useful in any maths l
Subjects:
Grades:
7th - 12th
Trigonometry Math Escape Room
This Math Escape Room themed on Trigonometry covers key concepts relating to this topic such as Theorem, Triangles, Theta, Angles and more! Escape Room is suitable for High School Math or Science students (Physics, Chemistry, Biology or Earth Sciences). How can this resource be adapted for social distancing?Upload / send the sheets digitally so students who can work independently through them (don’t use the keys or PPT tracker if so)Could use as part of a Recovery CurriculumSet the 7 Puzzles
Subjects:
Grades:
7th - 12th
Types of Graphs and Their Uses Flip Chart
This lesson discusses the definition of various types of graphs and their uses. Included topics: bar graphs, double bar graphs, line graphs, circle graphs, pictographs, and more.
Subjects:
Grades:
4th - 8th
Types:
Showing 1-24 of 50 results


