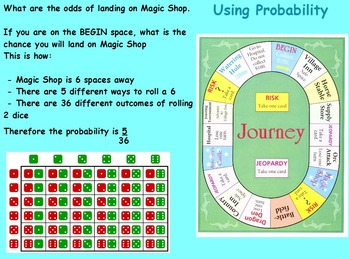
Probability - Playing a Board Game (SMART BOARD)
Engaging Einsteins
426 Followers
Grade Levels
6th - 8th, Homeschool
Subjects
Resource Type
Standards
CCSS7.SP.C.5
CCSS7.SP.C.6
CCSS7.SP.C.7
CCSS7.SP.C.7a
CCSS7.SP.C.7b
Formats Included
- Flipchart File
Pages
8 pages
Engaging Einsteins
426 Followers
Description
This document presents a tutorial on comprehending the concept of PROBABILITY in relation to playing a board game. It aims to provide a fundamental understanding of probability and includes a few inquiries to assess comprehension. Additionally, the material is aligned with state standards and objectives and includes a pre-class poll to gauge prior knowledge. The lesson utilizes engaging visuals and informative descriptions to captivate students of varying abilities. Its design ensures that all students are actively participating throughout the entire lesson, whether through board work with the teacher or completing the accompanying worksheet.
Total Pages
8 pages
Answer Key
N/A
Teaching Duration
3 days
Report this resource to TPT
Reported resources will be reviewed by our team. Report this resource to let us know if this resource violates TPT’s content guidelines.
Standards
to see state-specific standards (only available in the US).
CCSS7.SP.C.5
Understand that the probability of a chance event is a number between 0 and 1 that expresses the likelihood of the event occurring. Larger numbers indicate greater likelihood. A probability near 0 indicates an unlikely event, a probability around 1/2 indicates an event that is neither unlikely nor likely, and a probability near 1 indicates a likely event.
CCSS7.SP.C.6
Approximate the probability of a chance event by collecting data on the chance process that produces it and observing its long-run relative frequency, and predict the approximate relative frequency given the probability. For example, when rolling a number cube 600 times, predict that a 3 or 6 would be rolled roughly 200 times, but probably not exactly 200 times.
CCSS7.SP.C.7
Develop a probability model and use it to find probabilities of events. Compare probabilities from a model to observed frequencies; if the agreement is not good, explain possible sources of the discrepancy.
CCSS7.SP.C.7a
Develop a uniform probability model by assigning equal probability to all outcomes, and use the model to determine probabilities of events. For example, if a student is selected at random from a class, find the probability that Jane will be selected and the probability that a girl will be selected.
CCSS7.SP.C.7b
Develop a probability model (which may not be uniform) by observing frequencies in data generated from a chance process. For example, find the approximate probability that a spinning penny will land heads up or that a tossed paper cup will land open-end down. Do the outcomes for the spinning penny appear to be equally likely based on the observed frequencies?


