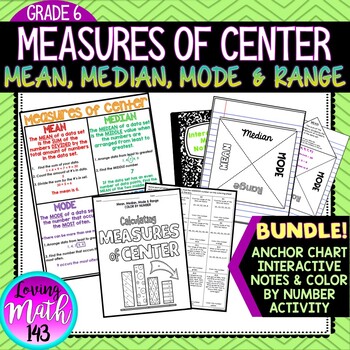
Mean Median Mode and Range Interactive Notes, Poster and Activity BUNDLE
- Zip
Products in this Bundle (3)
Description
Mean, Median, Mode & Range Color By Number Activity
This color by number activity is a fun and engaging way for students to practice calculating the measures of center including mean, median, mode and range. Students will solve 16 questions involving mean, median mode, and range then find their answer on the color by number sheet. If their answer is not on the color by number then their answer is not correct. This activity is aligned with the sixth (6th) grade common core standards.
WHATS INCLUDED:
★ 16 questions about mean, median, mode and range.
★ Outlier is included
★ Determining the missing value when given the mean is included
★ Determining the missing value when median is given is included.
★ Answer Key included.
***********************************************************************************************
2) Mean, Median, Mode & Range Interactive Math Notes
This excellent foldable is guided notes for the measures of center (mean, median, mode, and range) Three different inside versions are available depending on how much you would like filled in for your students. This is aligned with the 6th grade common core standards. These guided notes will make an excellent addition to your students' interactive math notebook and/or binder! They are also fun!
WHATS INCLUDED:
★ Definition of Mean
★ Steps on how to calculate the mean
★ Example on calculating the mean
★ Definition of median
★ Steps on how to calculate the median
★ Example on calculating the median
★ Definition of mode
★ Steps on how to calculate the mode
★ Example on calculating the mode
★ Definition of range
★ Steps on how to calculate the range
★ Example on calculating the range
★ THREE different inside versions
******************************************************************************************************
3) Mean, Median, Mode, Range Anchor Chart Poster
This anchor chart poster is a great tool to display in your classroom or distribute to your students to place in their interactive notebooks and/or binder. This anchor chart is great break down of mean, median, mode, and range. This anchor is aligned with the 6th and 7th grade Common Core standards students.
WHATS INCLUDED:
★ Definition of Mean, Median, Mode and Range
★ Steps for each measure of center.
★ Example for each data set.
******************************************************************************************************
LICENSING TERMS: This purchase includes a license for one teacher only for personal use in their classroom. Licenses are non-transferable, meaning they can not be passed from one teacher to another. No part of this resource is to be shared with colleagues or used by an entire grade level, school, or district without purchasing the proper number of licenses.
COPYRIGHT TERMS: This resource may not be uploaded to the internet in any form, including classroom/personal websites or network drives, unless the site is password protected and can only be accessed by students.


