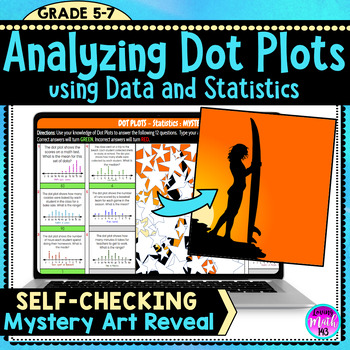
Analyzing Dot Plots using Data and Statistics Fun Digital Mystery Art Reveal
- Google Drive™ folder

Description
This Digital Self-Checking Math Activity allows middle school students to practice analyzing dot plots using data and statistics. Students will apply their understanding of line plots, mean, median, mode and range. Each correct will reveal part of a fun Mystery Picture! Great resource as independent practice or homework.
This is a perfect activity to check for understanding of probability and statistics during distance learning and students using Google Classroom™. You can share this activity with your students through Google Classroom™ or Google Drive™, which they can type directly onto, and then share back with you! This activity is aligned with the 6th grade Math Common Core Standards.
Why should you purchase this?
• Save Time with a No Prep Activity
• No- Grading (Self-Checking)
• Gives Students Instant feedback
• Interactive and Fun
• Completely Digital (Paperless)
How do Progression Art activities work?
• If students enter the incorrect answer into the answer box, it will turn red and no pieces of the mystery pixel art will appear.
• Pieces of the Mystery Picture will only appear if correct answers are typed into the cells.
What’s Included:
- Digital Self-Checking Mystery Pixel Art Activity for "Analyzing Dot Plots"
- 12 problems in all
- Picture Reveal: "Surfer"
*********************************************************************************************
LICENSING TERMS: This purchase includes a license for one teacher only for personal use in their classroom. Licenses are non-transferable, meaning they can not be passed from one teacher to another. No part of this resource is to be shared with colleagues or used by an entire grade level, school, or district without purchasing the proper number of licenses.
COPYRIGHT TERMS: This resource may not be uploaded to the internet in any form, including classroom/personal websites or network drives, unless the site is password protected and can only be accessed by students.


