30 results
7th grade statistics research under $5
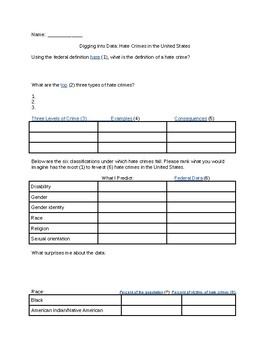
The 57 Bus- Looking at Hate Crime Data
A guided web search on hate crime data from the FBI, CDC, Pew Research Center, and U.S. Census Bureau. Uses reflection questions to make conclusions and predictions about the distribution of hate crimes. The kids are fascinated by the data!
Subjects:
Grades:
7th - 12th, Higher Education, Adult Education
Types:

The Best Movie Genre Project (Statistics Class)
High School and Middle School Statistics Class Project. People around the world love movies. Huge Blockbuster hits like Harry Potter, the Avengers, and The Fault in Our Stars made millions of dollars worldwide. But which movie genre is the best genre to invest in and earn the most profit around the world? For this project, students will be assigned a movie genre and sample different movies within each genre to determine the best movie genre of all time by looking at the gross profit the movie ma
Subjects:
Grades:
7th - 12th, Higher Education
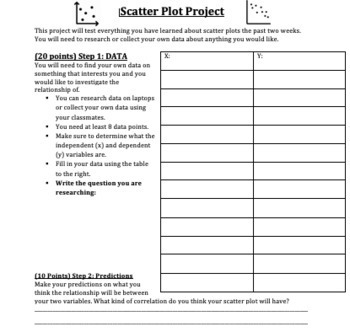
Scatter Plot Project
This is an awesome research project that is summative assessment for a Scatter Plot unit. For this project students are asked to pick a research question about bivariate data, gather the data online or through a survey. Next, they will make a prediction, construct a scatter plot, draw a line of best fit, find the equation of a line of best fit, and answer analytical questions about the data by interpreting the scatter plot. This is a great project that will allow students to utilize technology t
Subjects:
Grades:
7th - 10th
Types:

GRAY WOLF MATH PROJECT
Wolf. Wolves. Gray Wolf. Wildlife. Percent Applications. Threatened Species.Connect math to environmental science.Vilified by folklore and popular culture, there probably is no mammal in the world as misunderstood as the gray wolf. As a keystone species it is vital to maintaining a healthy ecosystem. It has largely been exterminated in the United States although recent conservation actions have seen a reintroduction of the gray wolf into Yellowstone National Park. Students will study habitat
Subjects:
Grades:
5th - 8th
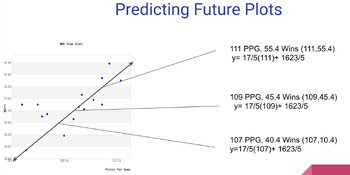
Scatter Plot Project on Desmos with Template
Learners will work to collect their own data from something they are interested in. They will then create a scatter plot using Desmos.com and analyze the information they collected. The analysis includes drawing their own trend line, finding the equation of that trend line, and predicting 3 values outside their original data collection. There are detailed directions with screenshots included along with a Google Slides template that can be shared with learners to help them organize their work. I
Subjects:
Grades:
7th - 9th
Types:
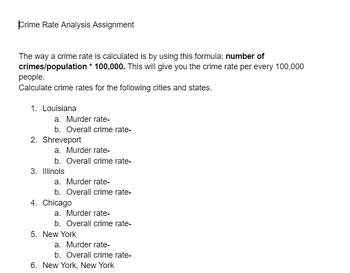
Crime Rate Analysis Assignment
A web based assignment to allow students to calculate the crime rates of various U.S. cities.
Grades:
5th - 12th, Higher Education, Adult Education
Types:
Math- Baseball: A Game of Numbers
In this Exploration, students will examine the statistics of four baseball players. The focus is to understand how the data is calculated. This classic American sport has always used math to keep track of everything that happens in the game. This math Exploration includes detailed, student-friendly Steps to Success that lead the learner through the process of creating a high-level, quality independent project. To add rigor and thoughtfulness, students reflect on their Exploration by answering s
Subjects:
Grades:
3rd - 8th
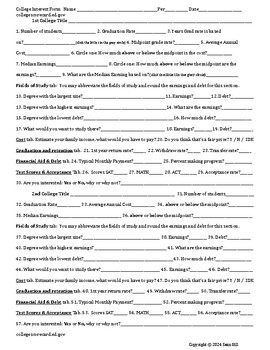
College Interest Form (College Research Unit 1st Lesson)
This is an excellent Introduction to college research. If your school is college focused or you just need a interested based activity to get the students engaged, this is an intriguing assignment that gets kids curious about different colleges and their stats. Did you know that the federal government compiles all the FAFSA data? It keeps track of how much money each person who filled out a FAFSA makes over the long term (10 years+). There is a wealth of data on every college that has ever accept
Subjects:
Grades:
6th - 12th
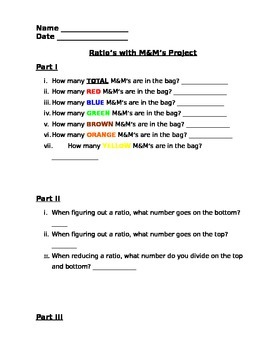
Ratios with M&M's Project
This is a quick assessment to help students figure out the ratios of M&M's in a bag. You provide the candy and I provide the worksheet. Students will be requested to open the bag, count all candies and than follow the directions marking ratios for each listed color.
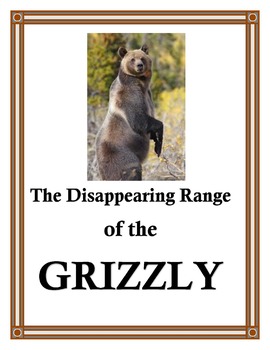
GRIZZLY BEAR MATH PROJECT
Grizzly Bear. Percent Applications. Math Project. Wildlife. Threatened Species. Connect math to environmental science. Kids love this project!Build awareness with your students around habitat loss for the majestic grizzly while using estimation and percent to calculate population numbers and habitat loss.Students will love learning about this amazing animal while using statistics in a meaningful way.The data for the grizzly populations for Canada and the United States is current and includes
Subjects:
Grades:
5th - 8th
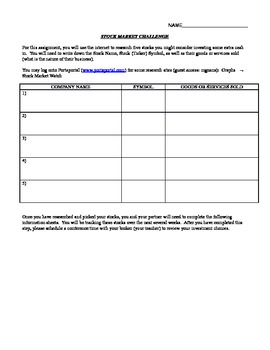
Stock Market Challenge Information Sheet
This document provides students a place to record the information they have gathered from their Stock Market research. It includes a place for students to record their stocks' 52-week high and low, dividends paid, does the company produce goods or provide services, as well as the reasoning as to why your student chose to purchase that particular stock. There are enough recording sheets for 5 stocks. This is a great way to teach students how to record and organize information for later use. If
Subjects:
Grades:
4th - 7th
Types:
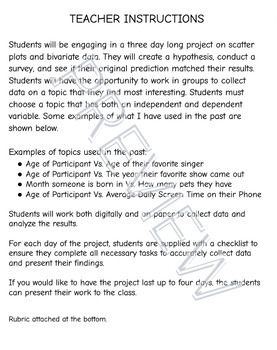
Scatter Plot and Bivariate Data Project
Students will be engaging in a three day long project on scatter plots and bivariate data. They will create a hypothesis, conduct a survey, and see if their original prediction matched their results. Students will have the opportunity to work in groups to collect data on a topic that they find most interesting. Rubric attached at the bottom.
Subjects:
Grades:
6th - 12th
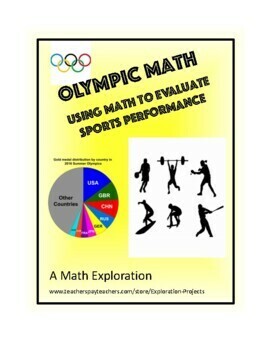
Math- Olympic Math:Using Math to Evaluate Sports Performances
Students will look at the Olympic games through a mathematical lens. Using their mathematical thinking they will use data and research to create graphs and story problems. If you are doing this Exploration during an Olympic year, students can use the data from this year. If there are no Olympics happening this year, choose a historic Olympics to analyze.This math Exploration includes detailed, student-friendly Steps to Success that lead the learner through the process of creating a high-level,
Subjects:
Grades:
3rd - 8th
Primary and Secondary Data
This lesson is the lesson after "Samples and Populations". This lesson has the content included and will allow students to engage in a research project as they discover the different methods included in Samples and Populations. This lesson supports the textbook "Maths Quest 8".
The resources that you will also need for this lesson is butchers paper and marker pens.
Subjects:
Grades:
7th - 9th
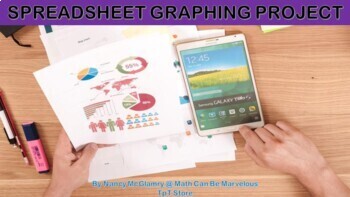
Spreadsheet Graphing Project
From this project, your students are given the opportunity to be creative designing online Microsoft Excel data tables and graphs. It requires them to research in the stock market about various companies. This package includes the following:(1) Teacher instructions;(2) Student instructions;(3) Student samples;(3) Grading rubric; and(4) 3 practice activities creating online data tables and graphs
Subjects:
Grades:
6th - 8th
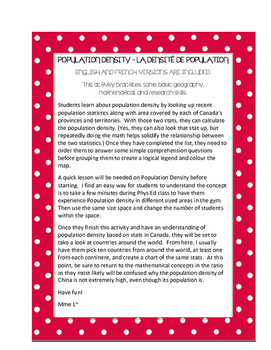
Population density - La densité de population
POPULATION DENSITY – LA DENSITÉ DE POPULATION
ENGLISH AND FRENCH VERSIONS ARE INCLUDED.
This activity practices some basic geography, mathematical, and research skills.
Warm-up to the idea with an experiential activity in the gym, then tackle the concept of Population Density. Students learn about population density by looking up recent population statistics along with area covered by each of Canada’s provinces and territories.
Subjects:
Grades:
7th - 10th
Types:
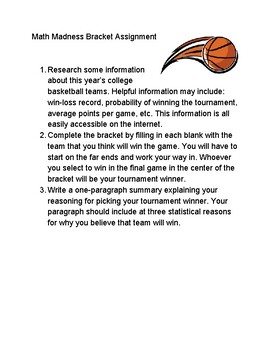
Math Madness Basketball Bracket Challenge with Research and Writing Assignment
This is a fun way to get students interested in math during the college basketball tournament. Students compete to create the best the tournament bracket using mathematical research. Assignment also includes a written portion of their explanation. Includes an example. This item included in all math madness bundles. For more basketball themed math items, visit my store!
Subjects:
Grades:
6th - 12th
Types:
Also included in: Math Madness: Bivariate Data in Basketball
Statistics Project
Use this product as a culmination of your statistics unit. Allow students to create their own question, survey their classmates, and analyze the results. This resource includes pages on - statistical questions - data collection - line plots - histograms- frequency tables - mean, median, mode, range- written conclusion - rubric
Subjects:
Grades:
5th - 7th
Types:
Also included in: Sixth Grade Math Bundle
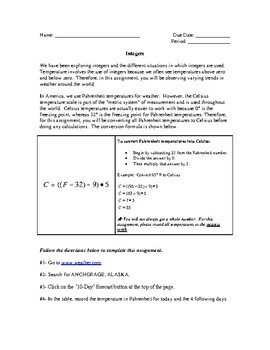
Integers and Weather
This project explores how weather incorporates integers into real life. Students also use a formula to convert between fahrenheit and celsius temperatures. In the end, students calculate the mean of the temperatures.
Subjects:
Grades:
7th - 8th
Types:

Marketing research project / Sports & Entertainment
Marketing is part of every business including sports and entertainment. The sports and entertainment industry include many different participants. Sports and entertainment events can only be improved by surveying participants to determine what they like and what needs to be changed to make the event better.
Subjects:
Grades:
7th - 12th
Types:
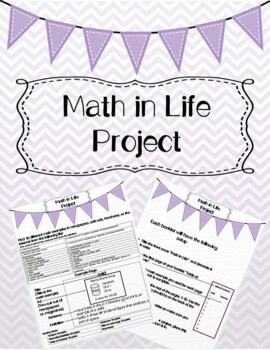
Math in Life Project
The Math in Life Project is a good way for students to see in advertisements how math they are learning in class relates to the real world. I will show them how appliances are cubic units and flooring and paint are square units. Recipes are good to find fractions and unit rates and rates are found in grocery ads.
Subjects:
Grades:
6th - 8th
Types:
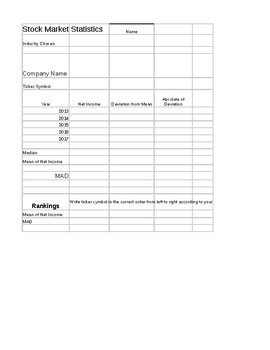
Stock Market Statistics Project
Students will use stocks of their choice to learn how the MAD can be used to calculate variability in the stock market. Students will also need to utilize their calculations in order to recommend a stock choice based on the parts of the project. They will write a letter of their stock choice to Warren Buffett using proper form describing their reasoning.
Subjects:
Grades:
7th
Types:
Standard Deviation Statistics Problem
Calculator Steps for finding the standard deviation
Subjects:
Grades:
7th - 12th
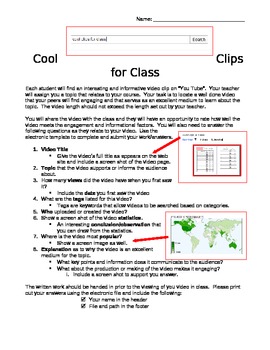
Cool Clips for Class: Using YouTube to Inform and Engage Students
This assignment involves students accessing the popular video website YouTube. The expectation is that student's research and document informative and engaging material that communicates an assigned topic or concept.
This activity includes a two page handout, a student question page that can be made available electronically with the questions for students to add answers and images and a peer evaluation sheet where students rate the videos presented by other students. The peer evaluation can
Grades:
7th - 12th
Types:
Showing 1-24 of 30 results


