11 results
7th grade statistics research $5-10
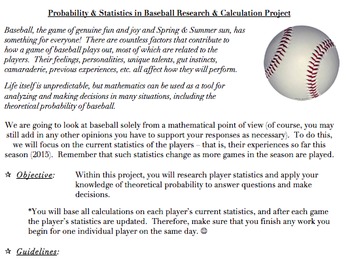
Probability & Statistics in Baseball Project (Common Core Aligned, AND FUN!)
The problems and activities within this document are designed to assist students in achieving the following standards: 6.SP.B.5, 7.SP.C, HSS.CP.A.2, HSS.CP.A.3, HSS.CP.B.7, HSS.CP.B.9, as well as the standards for mathematics practice and the literacy standards. They are also designed to help the teacher assess the students’ abilities when it comes to working with the ideas within the standards.This document contains the following:A project designed to allow students to investigate theoretical
Subjects:
Grades:
5th - 12th, Higher Education, Adult Education, Staff
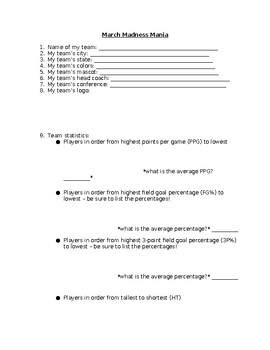
NCAA March Madness Basketball Tournament Team Research Statistics
Do you have students interested in the March Madness basketball tournament? Then this is the activity you need!To begin our March Madness unit, we look at all of the teams participating in the tournament and complete a map together to show where each team is from. We notice that some states have more than others and some states have none, and spend time discussing why that might be. Students will complete their own March Madness bracket.Students will then select a team in the NCAA March Madness
Grades:
4th - 9th
Types:

Scatter Plot and Bivariate Data Research Project
Students will begin a statistics project on one of their favorite restaurants or food chains! They will be researching nutrition facts and surveying others on what types of food they like to eat there. Through this data collection they will work on their skills of creating scatter plot graphs, creating relative frequency tables, and analyzing this data. This can be used either by paper or digitally. I used it the last two years during distance learning. Rubric included.
Subjects:
Grades:
7th - 12th
Types:
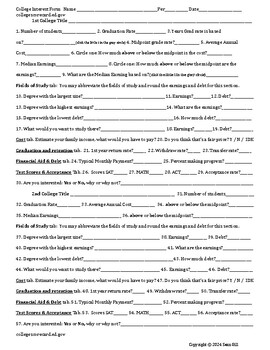
College Research Project Unit
This is an excellent unit on college research. If your school is college focused or you just need a interested based project to get the students engaged, this is a great way to get kids interested in colleges and their stats. Did you know that the federal government compiles all the FAFSA data? It keeps track of how much money each person who filled out a FAFSA makes over the long term (10 years+). There is a wealth of data on every college that has ever accepted federal funding and it is all at
Subjects:
Grades:
6th - 12th
Types:
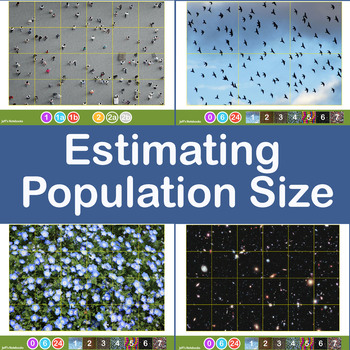
Estimating Crowd and Population Size using Jacob's Method
This investigation delves into estimating the size of a large population of objects by taking a sample and applying some basic mathematics. It encourages sharing of data, refining methods of collection of the data and discussion about the accuracy and limitations of the method used.Jacob's Method of counting large numbers of objects is simple. Draw a grid dividing the area covered into equal size squares. Estimate (by counting) the population of one grid then multiply this by the number of squar
Subjects:
Grades:
6th - 11th, Higher Education, Adult Education

Data Collection Survey Project: Grade 7
Students will complete a quantitative data survey of 20 students in the school. They will collect quantitative data and interpret and make conclusions from the data. Part 1 Data CollectionPart 2 Data Analysis Part 3 Data Conclusions & ObservationsPart 4 Reflection
Subjects:
Grades:
7th
Types:
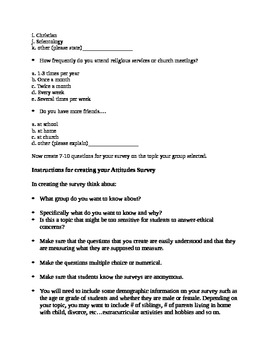
Research Paper-integrating Math and Science
This is a research paper that breaks down the topic and methodology into sections. The project is student driven. Student groups decide on a reseach topic that they can actually research but also create a survey to administer to students in the school so that they are collecting their own data.
The booklet begins with students creating survey questions, but you may want to first have them do the intro to the paper and their hypotheses before creating the survey questions.
Science is integrate
Subjects:
Grades:
7th - 12th, Adult Education
Types:
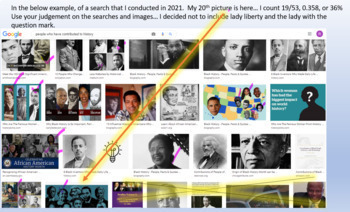
Women's History Month Probability Project
Students learn about suffrage and representatio of women. Students conduct Google searches on favorite subject, sport/hobby, future career and find the probability of a woman appearing in the first 20 images. Students make conjectures about representation of women in those areas. Students identify women they admire and create a video summarizing their findings.Can be adapted to images for African Americans for Black History Month, Hispanic Americans for Hispanic Heritage Month, etc.
Subjects:
Grades:
6th - 12th, Adult Education, Staff

End of Year Project
There are 3 projects in this bundle. I let students choose which option they wanted to do for their end of the year project.
The 1st project is creating a zoo with given parameters.
The 2nd project is determining who the best major league baseball player currently in the major leagues is based on research students conduct.
The 3rd project is creating a board game based on different parameters which must include a math concept from the school year.
These are great as end of unit projects or
Subjects:
Grades:
5th - 9th
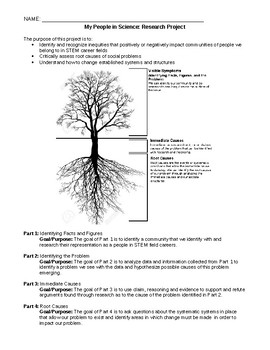
My People in Science Project
The purpose of this project is to:
• Identify and recognize inequities that positively or negatively impact communities of people we belong to in STEM career fields
• Critically assess root causes of social problems
• Understand how to change established systems and structures
Students will choose a community they identify with and will be conducting a thorough research project to find out this community's role in STEM subjects.
Grades:
6th - 12th
Types:
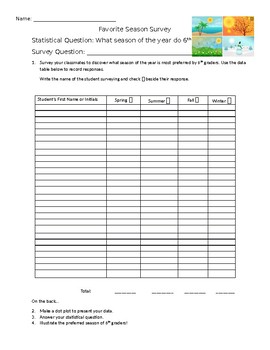
What is your favorite season? Practicing Statistics Class Survey
Students will practice the steps of statistics - gathering data, organizing data, analyzing data, interpreting and presenting data. Students will survey their classmates using the survey question, What is your favorite season? Students will practice statistical questions, data tables, dot plots and illustrations.
Subjects:
Grades:
5th - 8th
Types:
Showing 1-11 of 11 results


