216 results
Statistics research activboard activities
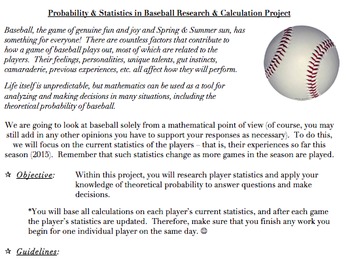
Probability & Statistics in Baseball Project (Common Core Aligned, AND FUN!)
The problems and activities within this document are designed to assist students in achieving the following standards: 6.SP.B.5, 7.SP.C, HSS.CP.A.2, HSS.CP.A.3, HSS.CP.B.7, HSS.CP.B.9, as well as the standards for mathematics practice and the literacy standards. They are also designed to help the teacher assess the students’ abilities when it comes to working with the ideas within the standards.This document contains the following:A project designed to allow students to investigate theoretical
Subjects:
Grades:
5th - 12th, Higher Education, Adult Education, Staff
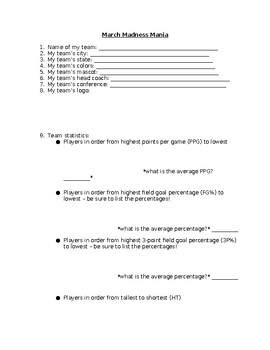
NCAA March Madness Basketball Tournament Team Research Statistics
Do you have students interested in the March Madness basketball tournament? Then this is the activity you need!To begin our March Madness unit, we look at all of the teams participating in the tournament and complete a map together to show where each team is from. We notice that some states have more than others and some states have none, and spend time discussing why that might be. Students will complete their own March Madness bracket.Students will then select a team in the NCAA March Madness
Grades:
4th - 9th
Types:
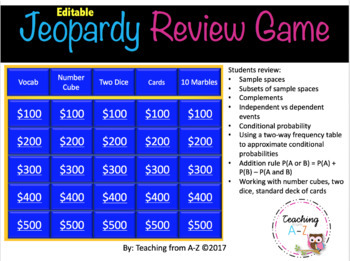
Probability Review Game
Use this Jeopardy-like review game to improve your students' understanding of key concepts in probability. This is a fun way to have students review:*Sample spaces*Subsets of sample spaces*Complements*Independent vs dependent events*Conditional probability*Using a two-way frequency table to approximate conditional probabilities*Addition rule P(A or B) = P(A) + P(B) – P(A and B)*Working with number cubes, two dice, standard deck of cardsThis is a PowerPoint Presentation. You can EDIT the problems
Subjects:
Grades:
9th - 12th
Also included in: Algebra Review Game Growing Bundle
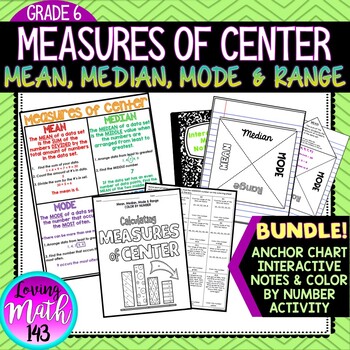
Mean Median Mode and Range Interactive Notes, Poster and Activity BUNDLE
Mean, Median, Mode & Range Color By Number ActivityThis color by number activity is a fun and engaging way for students to practice calculating the measures of center including mean, median, mode and range. Students will solve 16 questions involving mean, median mode, and range then find their answer on the color by number sheet. If their answer is not on the color by number then their answer is not correct. This activity is aligned with the sixth (6th) grade common core standards.WHATS INCL
Subjects:
Grades:
5th - 8th

Scatter Plot and Bivariate Data Research Project
Students will begin a statistics project on one of their favorite restaurants or food chains! They will be researching nutrition facts and surveying others on what types of food they like to eat there. Through this data collection they will work on their skills of creating scatter plot graphs, creating relative frequency tables, and analyzing this data. This can be used either by paper or digitally. I used it the last two years during distance learning. Rubric included.
Subjects:
Grades:
7th - 12th
Types:
MDM4U - Grade 12 Math - Mathematics of Data Management - FULL COURSE!
This is my complete course package for the Grade 12 Data Management (MDM4U) course following the Ontario Secondary Mathematics Curriculum. This package includes:Smart Notebook and PowerPoint lessons with Student PDF versions for every lesson of every unit in the course. (I have also included versions with my notes for your use)A complete student workbook that covers every lesson in the course. Each lesson concludes with appropriate workbook sections, so you can use whatever textbook you want!App
Subjects:
Grades:
12th
CCSS:
MDM4U - Statistical Analysis Unit - Full Teacher Package
This is my complete Statistical Analysis Unit package for the Grade 12 Data Management (MDM4U) course following the Ontario Secondary Mathematics Curriculum. This package includes:Smart Notebook, PowerPoint lessons with Student PDF versions for every lesson in the unit.A complete student workbook that covers every lesson in the unit. Each lesson concludes with appropriate workbook sections, so you can use whatever textbook you want!Appropriate unit tests/quizzes/assignments with answer keys.A fu
Subjects:
Grades:
12th
MDM4U - Organization of Data for Analysis Unit - Full Teacher Package
This is my complete Organization of Data for Analysis Unit package for the Grade 12 Data Management (MDM4U) course following the Ontario Secondary Mathematics Curriculum. This package includes:Smart Notebook and PowerPoint lessons with Student PDF versions for every lesson in the unit.A complete student workbook that covers every lesson in the unit. Each lesson concludes with appropriate workbook sections, so you can use whatever textbook you want!Appropriate unit tests/quizzes/assignments with
Subjects:
Grades:
12th
MDM4U - Probability Distributions Unit - Full Teacher Package
This is my complete Probability Distributions Unit package for the Grade 12 Data Management (MDM4U) course following the Ontario Secondary Mathematics Curriculum. This package includes:Smart Notebook and PowerPoint lessons with Student PDF versions for every lesson in the unit.A complete student workbook that covers every lesson in the unit. Each lesson concludes with appropriate workbook sections, so you can use whatever textbook you want!Appropriate unit tests/quizzes/assignments with answer k
Subjects:
Grades:
12th
MDM4U - Counting and Probability Unit - Full Teacher Package
This is my complete Counting and Probability Unit package for the Grade 12 Data Management (MDM4U) course following the Ontario Secondary Mathematics Curriculum. This package includes:Smart Notebook and PowerPoint lessons with Student PDF versions for every lesson in the unit.A complete student workbook that covers every lesson in the unit. Each lesson concludes with appropriate workbook sections, so you can use whatever textbook you want!Appropriate unit tests/quizzes/assignments with answer ke
Subjects:
Grades:
12th
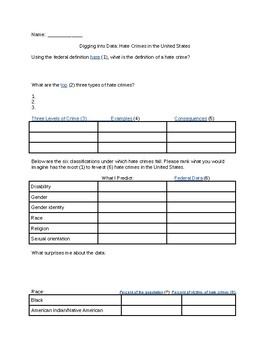
The 57 Bus- Looking at Hate Crime Data
A guided web search on hate crime data from the FBI, CDC, Pew Research Center, and U.S. Census Bureau. Uses reflection questions to make conclusions and predictions about the distribution of hate crimes. The kids are fascinated by the data!
Subjects:
Grades:
7th - 12th, Higher Education, Adult Education
Types:
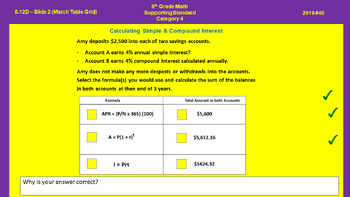
Math Jam Interactive Slides - 8th Gr Cate 4
Jamboard slides aligned to Math STAAR Release problems and new items types that include Equation Editor, Text Entry, Graphing, Number Line, Hot Spot, Fraction Model, Drag n Drop, Match Table Grid and Multiselect. Resource can be used to expose students to the new item types on the STAAR Redesign math assessment.
Subjects:
Grades:
8th
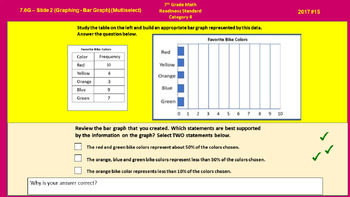
Math Jam Interactive Slides - 7th Grade Cate 4
Jamboard slides aligned to Math STAAR Release problems and new items types that include Equation Editor, Text Entry, Graphing, Number Line, Hot Spot, Fraction Model, Drag n Drop, Match Table Grid and Multiselect. Resource can be used to expose students to the new item types on the STAAR Redesign math assessment.
Subjects:
Grades:
7th
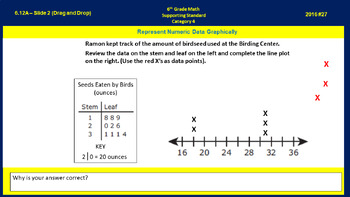
Math Jam Interactive Slides - 6th Gr Cate 4
Jamboard slides aligned to Math STAAR Release problems and new items types that include Equation Editor, Text Entry, Graphing, Number Line, Hot Spot, Fraction Model, Drag n Drop, Match Table Grid and Multiselect. Resource can be used to expose students to the new item types on the STAAR Redesign math assessment.
Subjects:
Grades:
6th
Types:
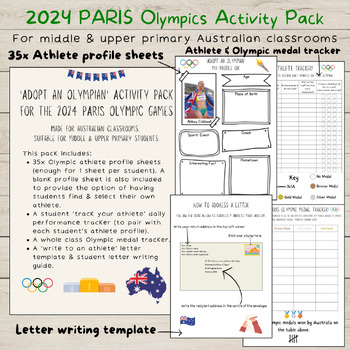
2024 PARIS Olympic Games Activity Pack | Middle & Upper Primary | Australia
Are you an Australian Teacher who is looking for a fun & engaging way to connect your students to the 2024 PARIS Olympic Games? This is the PERFECT resource for you! This activity pack provides students with the opportunity to:Research & profile an Australian Olympic athlete who has been selected to compete at the 2024 Paris Olympic Games.Individually track their athlete over the 19 days of the Olympic Games.Write a personal letter of support to their athlete, to be posted to them at the
Subjects:
Grades:
3rd - 6th
Types:

The Best Movie Genre Project (Statistics Class)
High School and Middle School Statistics Class Project. People around the world love movies. Huge Blockbuster hits like Harry Potter, the Avengers, and The Fault in Our Stars made millions of dollars worldwide. But which movie genre is the best genre to invest in and earn the most profit around the world? For this project, students will be assigned a movie genre and sample different movies within each genre to determine the best movie genre of all time by looking at the gross profit the movie ma
Subjects:
Grades:
7th - 12th, Higher Education
Categorical Data vs Numerical Data Flip Chart
In this flip chart, students will learn the difference between categorical data and numerical data, examples, and key vocabulary. The activinspire flip chart allows the teacher to reveal the information by removing the shapes over the correct information. At the end of the lesson are five questions which the students have to classify as categorical or numerical.
Grades:
5th - 8th
Types:

Statistics animated powerpoint lesson template
Content:1.Introduction2.Discrete Data3.Continuous Data4.Central Tendancy of a Data Set5.Range and Interquartile Range6.Box and Whisker Plot
Subjects:
Grades:
8th - 9th
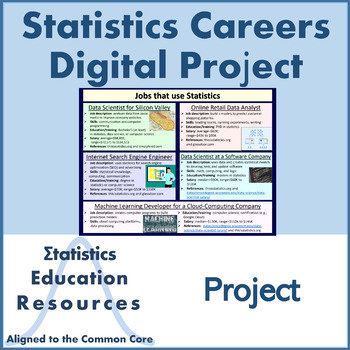
Careers in Statistics Digital Project
Distance Learning: Careers in Statistics Project Students complete this project by researching careers in statistics and creating a digital report. They select five careers and summarize their characteristics including job description, required skills (such as how statistics are used), education/training, and salary. Students may elect to create a digital poster (EDITABLE 24-inch by 18-inch template in PPTX included) or a short video report. Only want to assign a digital poster or only want vid
Subjects:
Grades:
9th - 12th
Types:
Also included in: Bundle: Algebra I Statistics Activities (Common Core Aligned)
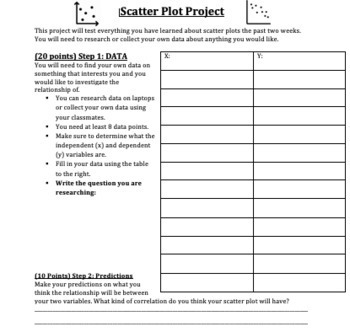
Scatter Plot Project
This is an awesome research project that is summative assessment for a Scatter Plot unit. For this project students are asked to pick a research question about bivariate data, gather the data online or through a survey. Next, they will make a prediction, construct a scatter plot, draw a line of best fit, find the equation of a line of best fit, and answer analytical questions about the data by interpreting the scatter plot. This is a great project that will allow students to utilize technology t
Subjects:
Grades:
7th - 10th
Types:

Statistics Research Project
This project can be done in an Algebra 1 class or in a beginning Statistics class.Through this project students will...- Create a two-question survey questionnaire (using Google Forms).- Conduct a survey that will produce quantitative data.- Interpret survey data, and use Desmos to generate the line of best fit.- Find the correlation coefficient and use these values determine how well the line of best fit models the data.- Generate a residual plot and use it to interpret data.- Find the sum of t
Subjects:
Grades:
8th - 12th
Also included in: Math in the Real World Projects Bundle

Statistics animated powerpoint template lesson part 1
Statistics animated lesson:content:1.Introduction2.Discrete Data3.Continuous Data4.Central Tendancy of a Data Set
Subjects:
Grades:
8th - 9th
Also included in: Statistics animated powerpoint lesson template
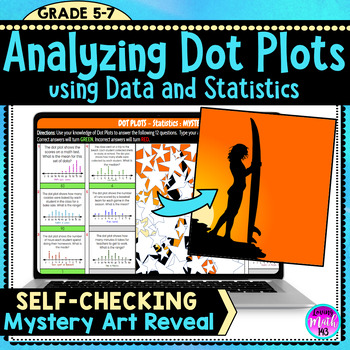
Analyzing Dot Plots using Data and Statistics Fun Digital Mystery Art Reveal
This Digital Self-Checking Math Activity allows middle school students to practice analyzing dot plots using data and statistics. Students will apply their understanding of line plots, mean, median, mode and range. Each correct will reveal part of a fun Mystery Picture! Great resource as independent practice or homework.This is a perfect activity to check for understanding of probability and statistics during distance learning and students using Google Classroom™. You can share this activity wit
Subjects:
Grades:
6th - 7th

Statistics animated powerpoint lesson template part 2
Statistics part 2:1.Range and Interquartile Range2.Box and Whisker Plot
Subjects:
Grades:
8th - 9th
Also included in: Statistics animated powerpoint lesson template
Showing 1-24 of 216 results


