
Get Science Fair Ready! Project Based Learning Data Literacy for Middles School


- PDF
- Easel Activity
Also included in
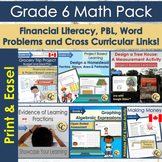 Everything you need to assess grade 6 math in a meaningful and engaging way. Grade 6 Math Pack for Canadian Students includes: project based learning, financial literacy, data literacy and real-world word problems, all specifically Canadian!Works great in-class or for remote learning.→ For the GoogPrice $14.00Original Price $20.50Save $6.50
 Everything you need to assess grade 6 math in a meaningful and engaging way. The Grade 6 Math Pack includes: project based learning, financial literacy, data literacy and real-world word problems! Works well for end-of-year assessments and activities.Works great in-class or for remote learning.ClicPrice $12.00Original Price $18.00Save $6.00
 Teach data management and the design process through science fair projects! And a fully editable unit to teach and assess the particle theory of matter. Everything is included to have students learn about data, collect data and present a meaningful research project.Cross-curricular links to data, biPrice $9.50Original Price $13.00Save $3.50
Description
Science fair project that helps you teach data management, statistics and probability. Real data and meaningful science! The data literacy and research project covers everything middle school students need to know about collecting and interpreting data for their own animal observation observation project. Great for science fairs! Learn about collecting objective, non-bias data and how to recognize it in the real world.
→ Everything is included to have students learn about data, collect data and present a meaningful research project.
Students can personalize their project so each student will end up with different findings, data, and a different presentation!
This unit walks students through creating an animal observation scientific research project. Each project will be a little different, but the example uses bird observations. It can easily be adapted for each student's animal of choice, from spiders to coyotes, whatever is in your area! There is even instructions on how to find and use observation data available online.
The final result is a presentation of meaningful data about the animals in your area.
⏰ 4-5 weeks worth of work for most middle school students.
Can be done independently and completely remotely.
☼ Preview contains example of many slides and screen shots of the Easel Activity. ☼
Includes:
- Easel Activity (44 slides, includes interactive questions, rubric, success criteria and place for teacher feedback).
- Word banks
- Activities
- 5 lessons that include questions and answers
- Subjective vs. objective data
- Raw data, (methods)
- How to organize and display data, (results)
- Factors that affect data, (discussion)
- How to draw conclusions and infer, (conclusions)
- Scientific research report expectations
- Data collection templates
- How to identify your guiding question
- Guidance how to write each section and how to present
- Success criteria
- Rubric
- Feedback template
→ Check out my project based learning resources, here. ←
$ $ $ $ $ $ $ Canadian Financial Literacy for Middle School $ $ $ $ $ $ $
Or American Financial Literacy
☺☺☺☺☺☺☺ To get the latest from The Christian Curriculum, follow me! ☺☺☺☺☺☺☺
