715 results
Statistics projects under $5
6th Grade Statistics Project: Analyzing Zombie Virus with Dot Plots and Mean
I created this project as a way for my 6th graders to practice their statistical skills. They loved it! They get to pretend to be epidemiologists studying a virus outbreak that is turning people into zombies. It's a fantastic way for students to see how statistics is used in the "real world" - they were also very interested to learn about the field of epidemiology. The Project: Students are given data about infected people who are quarantined in an airport. They are also given two maps of the US
Subjects:
Grades:
5th - 7th
Types:
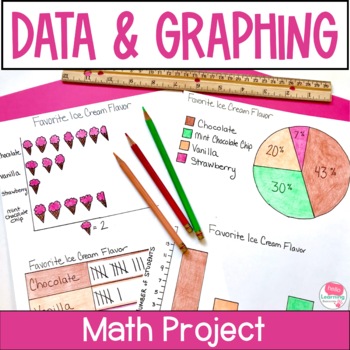
Data and Graphing Project - Real World Math Project Based Learning Activities
This data and graphing project gives your students a meaningful way to apply their data and graphing skills. Use this real world math project as an end of unit activity, enrichment activity or assessment. Easy to use and fun for students!Click the PREVIEW button above to see everything that is included in this fun math project!⭐ This resource includes:teacher information, directions and sample schedulesupply listgrading rubricstudent direction sheettwo data collection sheets (one for open ended
Subjects:
Grades:
4th - 6th
Types:
CCSS:
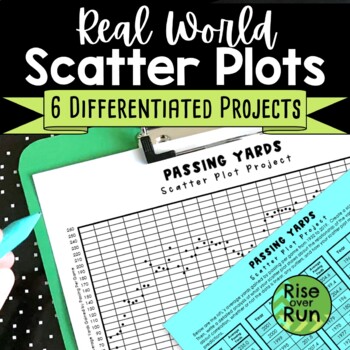
Scatter Plot Project with Real World Sports Data
Practice creating and analyzing scatter plots with these six differentiated real world projects. Students are provided statistics for a sport and must graph the data. Then, they write an analysis describing correlation, whether or not the data is linear, any outliers, and how the scatter plot might be used to make predictions. The scatterplots range from 38 points to 149 points, so they can be used to differentiate. The scatter plots will take a little time to plot, but they result in real
Subjects:
Grades:
8th - 9th
Types:
CCSS:
Also included in: 8th Grade Math Activities & Lessons Bundle for the Whole Year
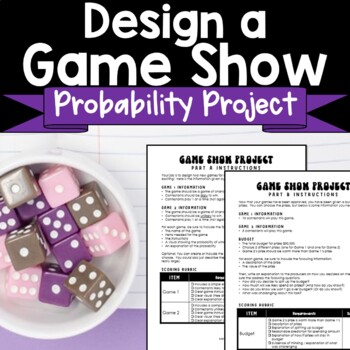
Probability Project Design a Gameshow Game
Look for fun probability activities? Students get creative as they design games for gameshows in this engaging project about simple and compound probability! Instructions are included to guide students in completing the following:Design a game based on a simple eventDesign a game based on a compound eventExplain the probabilities of winningChoose prizes based on a budget and probabilities of winningThe project is split into 2 parts with a rubric for grading each one.You might provide students so
Subjects:
Grades:
7th - 10th
Types:
Also included in: 7th Grade Math Activities, Lessons, Projects & More Bundle
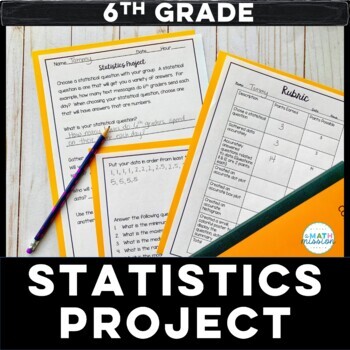
Math Statistics Project Based Learning Dot Plot Box Plot Histogram
Set your students loose to practice their statistics skills! This project is great for a culminating assessment. This project is centered around students coming up with a statistical question, and gathering data on that question. Students answer statistical questions, and create a dot plot, box and whisker plot and histogram based on the data collected. A summary of their findings is then created to display for others to see. A rubric is included for grading purposes. This project actively
Subjects:
Grades:
5th - 7th
Types:
Statistics Project - Statistics Olympics
Engage your students in their study of statistics as they compete in self-created Olympic style events. This project will engage students and help them discover meaning and apply concepts including measures of central tendency, quartiles, outliers, variance, standard deviation, z-scores, box plots, histograms, normal and skewed distributions. This project can be completed in approximately 6-8 days (50-min class periods) ** March 2023 Update **Visual updates to all slides and documentsRubric ali
Subjects:
Grades:
6th - 12th
CCSS:
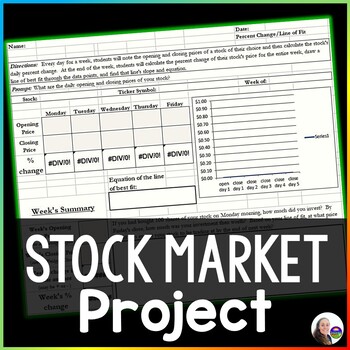
Stock Market Math Project | Build Personal Financial Literacy
This stock market project asks students to follow a stock of their choice for a week, calculate the daily and weekly percent change in price, estimate a line of fit for their scatter plot, find the slope and equation of their line of fit and write a final analysis of their data. The project is editable so you can customize as you need to for your students. Also now includes a link to a Google Sheet version for online learning.The final spreadsheet is formatted with formulas that automatically ca
Subjects:
Grades:
7th - 9th
Types:
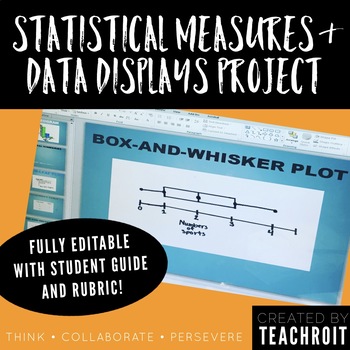
Statistics & Data Display Project for 6th Grade Math PBL (Fully Editable)
This product includes a student guide for a 6th grade middle school mathematics project that will require students to develop a statistical question, conduct a survey with their classmates, create numerical summaries, represent their findings using visual data displays, and finally present their findings! The thorough student guide provides step by step directions for each part of the project and could be used as either an in class project or to be assigned as homework. The student guide also in
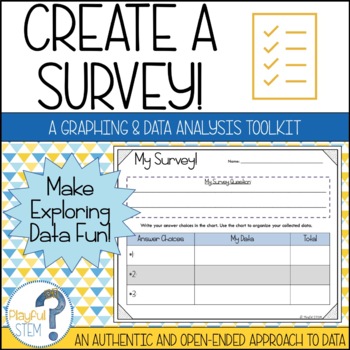
Create Your Own Survey: Collect, Organize, Graph, and Analyze Data
One of my best-selling TPT products -- now updated with a fresh look and new content!Teach Data Analysis the open-ended and engaging way -- through student-directed surveys!This resource pack is designed to help students follow the process of creating a survey: they will brainstorm questions, collect data, organize their obtained data, create multiple graphs to show their data, and then reflect on and analyze what their data tells them.The survey pack includes the following:Brainstorming Survey
Subjects:
Grades:
2nd - 5th
Types:
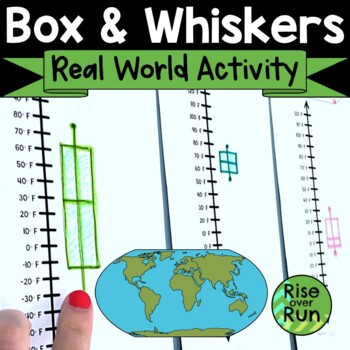
Box and Whiskers Plot Activity with Real World Data Comparisons
Help students understand how and why to use box & whiskers plots with this real world application using data about temperatures in different cities. Students use data about the highest average temperature for each month in a city. They locate it on a world map and then create a vertical box plot using the vertical number line provided. Once students create their individual cities’ box plots, all the data can be displayed on a wall for comparison. This leads to some great discussions about t
Subjects:
Grades:
6th - 7th
Types:
Also included in: Algebra 1 and 8th Grade Math Curriculum Bundle for Entire Year
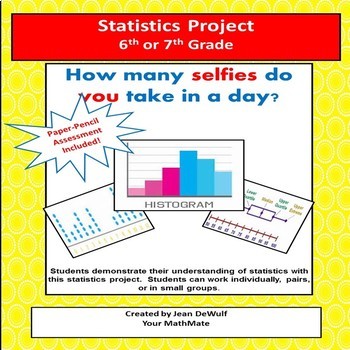
Statistics Project for 6th or 7th Grade! Bonus Assessment Included.
Your students are going to LOVE this interactive Statistics Project!You can choose either paper/pencil or digital formats for this project.Students can work individually, in pairs or in small groups.There are 5 parts to this project: Part I: Creating a Statistical Question Part II: Collecting Data & Determining the Measures of Center, Variation & 5 number summary. Part III: Creating 3 Graphs; a histogram, a dot plot and a box-n-whisker plot. Part IV: Written Description. Students will an
Subjects:
Grades:
6th - 7th
Types:
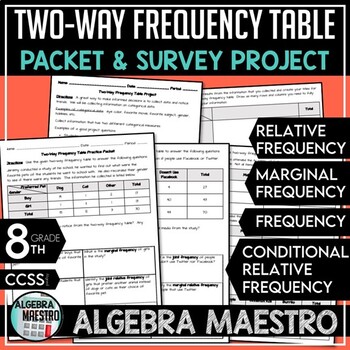
Two-Way Frequency Table Practice Packet & Project
With the Two-Way Frequency Table (or two way tables) Practice Packet & Project you'll receive:-3 pages of student practice via packet-3 pages of the answer key for the packet-2 pages for the student driven projectThe Two-Way Frequency Table Packet and Project are meant to be a review and reinforcement activity. Students can practice and further enhance their understanding using the Packet Practice. Teacher may want to further differentiate the content for advanced students and give them th
Subjects:
Grades:
7th - 12th, Higher Education, Adult Education
Types:
CCSS:
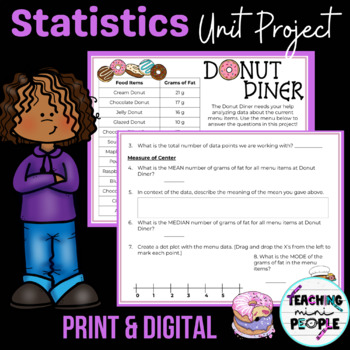
Statistics Project | 6th Grade Math Activity | Editable
This EDITABLE Statistics Unit Project is perfect for reviewing the unit with one set of data. Students use a donut shop menu to analyze grams of fat data. Students practice with histograms and dot plots, measures of center, measures of spread, and the shape of distribution. **This product has been updated to add an EDITABLE print version! You can now edit the numbers as well as the questions asked about the data. Included: ➜ Teacher directions➜ Print Version for Students➜ Digital Version for Stu
Subjects:
Grades:
5th - 7th
Types:
Also included in: 6th Grade Statistics | Measure of Center | Box Plots | 5 Number Summary
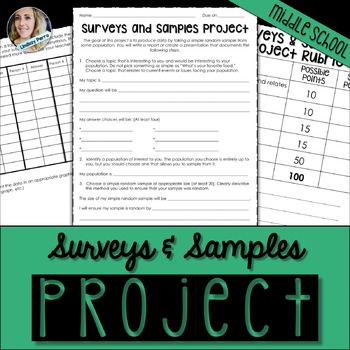
Surveys and Samples Math Project
About this resource :
This surveys and samples project has students create a survey question, deliver it to a population of interest, chart, graph and discuss the results. The project is 3 pages long, giving students space to work and show their results. A rubric is included.
Available as part of the following bundles :
Middle School Math Activities Bundle
7th Grade Math Curriculum Resources Mega Bundle
Licensing Terms :
By purchasing this product, you own a license for one teacher only for
Subjects:
Grades:
7th - 11th
Types:
Also included in: 7th Grade Math Curriculum Supplemental Activities Bundle
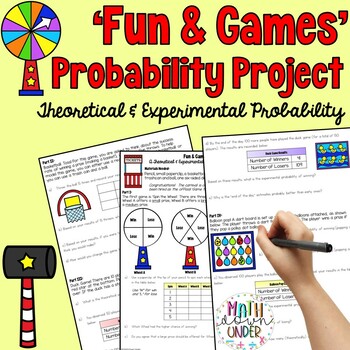
Probability Math Project (Experimental & Theoretical Probability) 'Fun & Games'
Fully engage your students during your probability unit or at the end of the year with this fun math project for middle school! A real-world application of theoretical and experimental probability, I have successfully used this project with 7th grade and 8th grade students.This project finds your students as the new carnival game tester! They will work through 6 parts, testing each game using theoretical and experimental probability. Students will also recreate some of the carnival games using s
Subjects:
Grades:
7th - 8th
Types:
Also included in: 7th Grade Statistics and Probability Activity Bundle
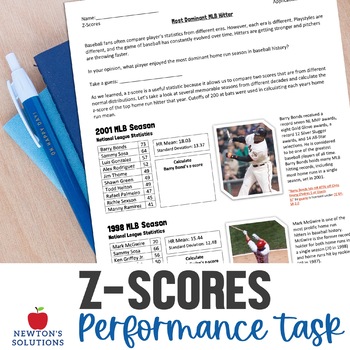
Z-Score and Normal Distribution Application Task Project
Z-Scores Application Task: In this project/application task, students will apply their knowledge of z-scores and use them in a real world situation. Students will take a look at data from different Major League Baseball seasons and compare sluggers from different decades. An answer key is included.___________________________________________________________________LICENSING TERMS: This purchase includes a single license that may only be assigned to a single specific individual user. Individual li
Subjects:
Grades:
9th - 11th
Types:
CCSS:
8th Grade Statistics Project- Scatter Plots: Analyzing Asthma
I created this project as a fun way for my 8th grade students to apply their knowledge of scatter plots in a meaningful way. They had a lot of fun!Students pretend to be biostatisticians investigating why asthma rates in a city are skyrocketing. Students get to uncover the environmental cause of the increased rates of asthma and investigate how different factors are associated with asthma attacks.Students get lots of practice: - creating scatter plots using a table of data- selecting an appropri
Subjects:
Grades:
8th - 10th
Types:
CCSS:
High School Data Analysis Project
This project covers a large range of data analysis methods. There are eleven total parts to the project.
Part One: the students have to collect data from 20 students outside of the classroom. Directions specify to ask students from each grade level.
Part Two: Measures of Center and Variation. Students will calculate mean, median, mode, range, and standard deviation for some of the data collected. Definitions of each term are included.
Part Three: Box-And-Whisker Plot. Students will create t
Subjects:
Grades:
9th - 12th
Types:
CCSS:
Skittles Statistics Project (6.SP.2, 6.SP.4, 6.SP.5)
Using a Fun Size Skittles Bag, students will make predictions as to the number of colors in each bag. They will then record the actual number of skittles of each color in the bag and convert those numbers into a fraction, decimal, and a percent. Using the class data, students will record the number of purple Skittles in each of their classmates' bags. They will use this data to find the mean, median, and mode, create a histogram, a dot plot (line plot), and box plot (box and whisker plot), find
Subjects:
Grades:
6th
Types:
Statistics Project - Middle School Math 6.SP
I designed this project to use a major grade instead of a test. This can be done individually, or in groups. I have included the data cards that I handed out to my groups, but feel free to have them gather their own data, or make up your own. The purpose of this project was to analyze the students’ abilities to create a box plot, a histogram, and a stem and leaf plot. They will have to figure out on their own that those are the three displays that will best fit the data I gave them.
This is al
Subjects:
Grades:
6th - 8th
Types:
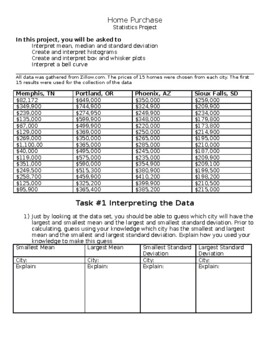
Home Prices: High School Statistics Project
This statistics project has students exploring home prices and using their knowledge of mean, median, standard deviation, histograms, box and whisker plots, and bell curves to make predictions and inferences about the data. This project is provided in a word document to allow the teacher the ability to edit the document or load it to a google doc. In this project students first make predictions about measures of spread and central tendency without calculating but by looking at the data. Students
Subjects:
Grades:
9th - 12th
Types:
CCSS:
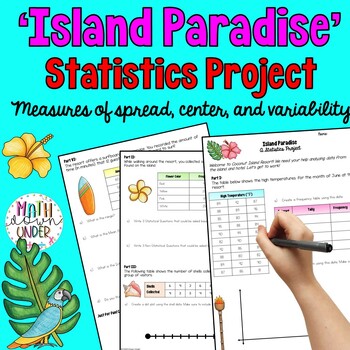
6th Grade Statistics Math Project - "Island Paradise"
Fully engage your students during your Statistics unit with this fun math project for 6th grade!This project finds your students visiting the Coconut Island Resort and conducting some data analysis. They will work through 6 parts practicing drawing histograms and dot plots, interpreting box plots, statistical questions, measures of center (mean, median, mode, and range), measures of spread, and measures of variability (Interquartile range and Mean Absolute Deviation).This project took my class 2
Subjects:
Grades:
6th
Types:
Also included in: 6th Grade Statistics Activity Bundle
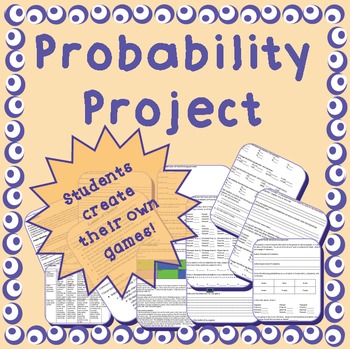
Theoretical & Experimental Probability Project - middle/high school
Engage your students with this hands-on, interactive, game-creating project!Why should you purchase this product?• it's hands-on, active learning• it engages the kinesthetic learner• it allows students to apply concepts• it differentiates instruction through product• it has contingency/alternate assignments if necessaryFor this project, students work in groups to create a carnival-style game to demonstrate their knowledge of theoretical and experimental probability. File contains project directi
Subjects:
Grades:
7th
Types:
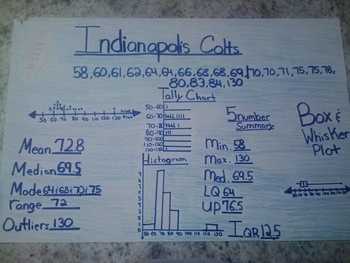
Favorite Sports Team: Data Displays and Measures of Central Tendency Project
Students will create a poster using sports statistics. Depending on the time of year, you may want to use football scores, basketball scores, data from the Olympics, etc. Students will use the internet (or you can print out statistics for them) to find sports data.
The students really buy into this project because it is about something they are interested in - their favorite sports team!
Students will display their knowledge of several data displays: line plot, tally chart, histogram and bo
Subjects:
Grades:
5th - 8th
Types:
Showing 1-24 of 715 results


