350+ results
High school statistics projects under $5
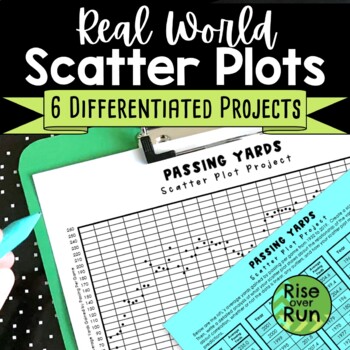
Scatter Plot Project with Real World Sports Data
Practice creating and analyzing scatter plots with these six differentiated real world projects. Students are provided statistics for a sport and must graph the data. Then, they write an analysis describing correlation, whether or not the data is linear, any outliers, and how the scatter plot might be used to make predictions. The scatterplots range from 38 points to 149 points, so they can be used to differentiate. The scatter plots will take a little time to plot, but they result in real
Subjects:
Grades:
8th - 9th
Types:
CCSS:
Also included in: 8th Grade Math Activities & Lessons Bundle for the Whole Year
Statistics Project - Statistics Olympics
Engage your students in their study of statistics as they compete in self-created Olympic style events. This project will engage students and help them discover meaning and apply concepts including measures of central tendency, quartiles, outliers, variance, standard deviation, z-scores, box plots, histograms, normal and skewed distributions. This project can be completed in approximately 6-8 days (50-min class periods) ** March 2023 Update **Visual updates to all slides and documentsRubric ali
Subjects:
Grades:
6th - 12th
CCSS:
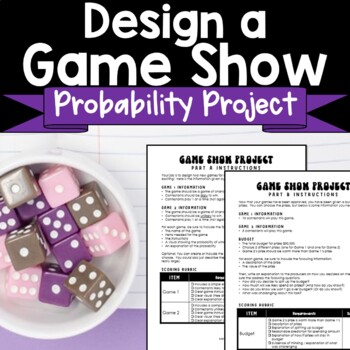
Probability Project Design a Gameshow Game
Look for fun probability activities? Students get creative as they design games for gameshows in this engaging project about simple and compound probability! Instructions are included to guide students in completing the following:Design a game based on a simple eventDesign a game based on a compound eventExplain the probabilities of winningChoose prizes based on a budget and probabilities of winningThe project is split into 2 parts with a rubric for grading each one.You might provide students so
Subjects:
Grades:
7th - 10th
Types:
Also included in: 7th Grade Math Activities, Lessons, Projects & More Bundle
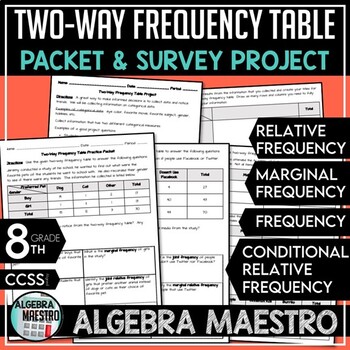
Two-Way Frequency Table Practice Packet & Project
With the Two-Way Frequency Table (or two way tables) Practice Packet & Project you'll receive:-3 pages of student practice via packet-3 pages of the answer key for the packet-2 pages for the student driven projectThe Two-Way Frequency Table Packet and Project are meant to be a review and reinforcement activity. Students can practice and further enhance their understanding using the Packet Practice. Teacher may want to further differentiate the content for advanced students and give them th
Subjects:
Grades:
7th - 12th, Higher Education, Adult Education
Types:
CCSS:

Stock Market Project | Build Personal Financial Literacy
This stock market project asks students to follow a stock of their choice for a week, calculate the daily and weekly percent change in price, estimate a line of fit for their scatter plot, find the slope and equation of their line of fit and write a final analysis of their data. The project is editable so you can customize as you need to for your students. Also now includes a link to a Google Sheet version for online learning.The final spreadsheet is formatted with formulas that automatically ca
Subjects:
Grades:
7th - 9th
Types:
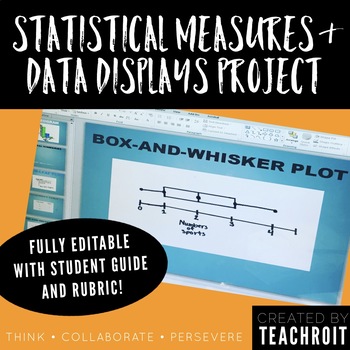
Statistics & Data Display Project for 6th Grade Math PBL (Fully Editable)
This product includes a student guide for a 6th grade middle school mathematics project that will require students to develop a statistical question, conduct a survey with their classmates, create numerical summaries, represent their findings using visual data displays, and finally present their findings! The thorough student guide provides step by step directions for each part of the project and could be used as either an in class project or to be assigned as homework. The student guide also in
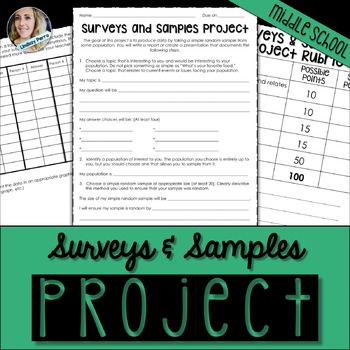
Surveys and Samples Math Project
About this resource :
This surveys and samples project has students create a survey question, deliver it to a population of interest, chart, graph and discuss the results. The project is 3 pages long, giving students space to work and show their results. A rubric is included.
Available as part of the following bundles :
Middle School Math Activities Bundle
7th Grade Math Curriculum Resources Mega Bundle
Licensing Terms :
By purchasing this product, you own a license for one teacher only for
Subjects:
Grades:
7th - 11th
Types:
Also included in: 7th Grade Math Curriculum Supplemental Activities Bundle
8th Grade Statistics Project- Scatter Plots: Analyzing Asthma
I created this project as a fun way for my 8th grade students to apply their knowledge of scatter plots in a meaningful way. They had a lot of fun!Students pretend to be biostatisticians investigating why asthma rates in a city are skyrocketing. Students get to uncover the environmental cause of the increased rates of asthma and investigate how different factors are associated with asthma attacks.Students get lots of practice: - creating scatter plots using a table of data- selecting an appropri
Subjects:
Grades:
8th - 10th
Types:
CCSS:
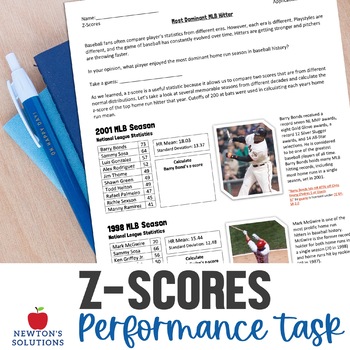
Z-Score and Normal Distribution Application Task Project
Z-Scores Application Task: In this project/application task, students will apply their knowledge of z-scores and use them in a real world situation. Students will take a look at data from different Major League Baseball seasons and compare sluggers from different decades. An answer key is included.___________________________________________________________________LICENSING TERMS: This purchase includes a single license that may only be assigned to a single specific individual user. Individual li
Subjects:
Grades:
9th - 11th
Types:
CCSS:
High School Data Analysis Project
This project covers a large range of data analysis methods. There are eleven total parts to the project.
Part One: the students have to collect data from 20 students outside of the classroom. Directions specify to ask students from each grade level.
Part Two: Measures of Center and Variation. Students will calculate mean, median, mode, range, and standard deviation for some of the data collected. Definitions of each term are included.
Part Three: Box-And-Whisker Plot. Students will create t
Subjects:
Grades:
9th - 12th
Types:
CCSS:
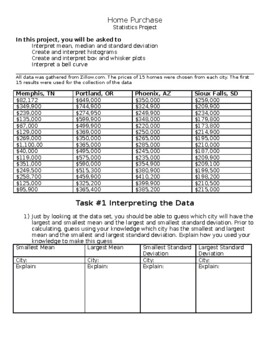
Home Prices: High School Statistics Project
This statistics project has students exploring home prices and using their knowledge of mean, median, standard deviation, histograms, box and whisker plots, and bell curves to make predictions and inferences about the data. This project is provided in a word document to allow the teacher the ability to edit the document or load it to a google doc. In this project students first make predictions about measures of spread and central tendency without calculating but by looking at the data. Students
Subjects:
Grades:
9th - 12th
Types:
CCSS:
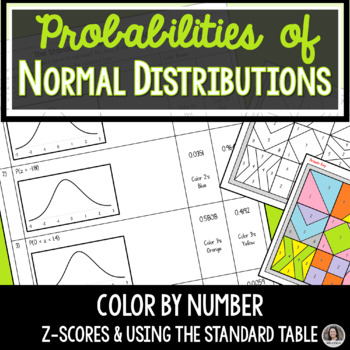
Probabilities of Normal Distribution, Z Scores Activity Project
Students shade the area under the normal distribution curve and determine the probabilities for the given z-scores in this color by number activity. Their answers will determine what color they will need to use to color the provided image. This self-checking activity allows students to work independently to practice their understanding of using The Standard Table to determine probabilities of normal distributions.The color by number activity can be assigned in a variety of ways. 1. Assign The S
Subjects:
Grades:
6th - 12th, Higher Education
Types:
Statistics Projects: Collecting Authentic Data for Graphing and Analysis
Engage your students in Statistics. Students generate their own statistical question and then collect authentic data to graph, calculate and reflect upon the results. This is a great activity for a Back to School Project! It works well as a stand-alone Statistics project anytime during the year. This project aligns well to Common Core Standards for Math. Included in this package are:-measures of center (mean, median, mode)-range-bar and line graphing-data collections -reflective questions f
Subjects:
Grades:
5th - 9th
Types:
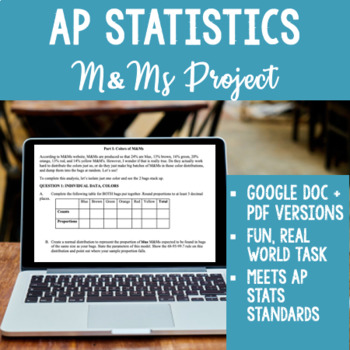
AP Statistics M&M Sampling Distribution Project - Works for Distance Learning!
NEW for 2020! This resource now includes both a PDF for printing out a physical copy AND a fully editable Google Doc link for remote or distance learning! Assign the Google doc to your students, and they can type their answers directly into the document and submit their work digitally. They can also create normal curve diagrams in Google Docs using Insert-Image (kids figure out how to do this quite quickly, as I learned this year!)I use this project every year in my AP Statistics class to demyst
Subjects:
Grades:
10th - 12th
Types:
Also included in: AP Statistics Project Bundle! 6 Projects + digital versions
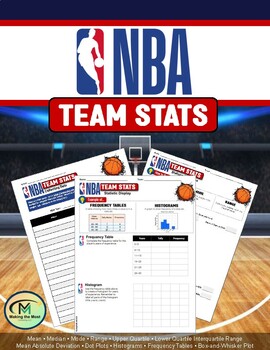
NBA Team Stats (Mean, Range, Median, Interquartile Range, Box Plots, Histograms)
This guided practice worksheet connects basic statistics with students' favorite NBA teams. Students are required to find the mean, range, median, and interquartile range (with box-and-whisker plot) of their favorite team's players' age, weight, and years in the NBA. Your students will love this engaging activity.
Subjects:
Grades:
6th - 12th
Types:
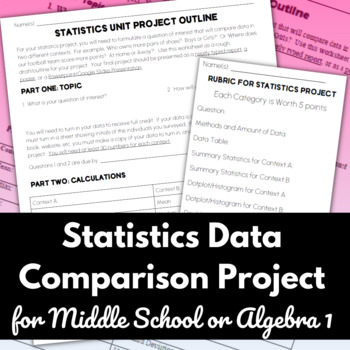
Statistics Data Comparison Project -Data Collection, Summary Statistics & Graphs
Engaging, easy prep statistics data collection project! Students develop a research question comparing data from two different contexts, collect data, then use summary statistics, measures of central tendency, and graphs to find the answer to their question. Perfect way to incorporate project-based learning into your statistics unit for middle school or algebra.Students choose a question of interest where they will compare two sets of data using summary statistics (mean, median, etc.) and graph
Subjects:
Grades:
7th - 9th
Types:
CCSS:
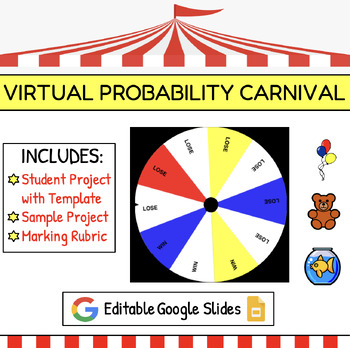
Virtual Probability Carnival | Math Project for End of Year | Google Slides
In this digital project students learn about what it means for a game to be fair as they design and play fair and unfair probability carnival games. This project is open-ended and can be easily differentiated to meet the needs of all learners and it is an engaging way to learn math during the end of year. The entire project is done using Google slides and Google forms, making it perfect for distance learning or the socially-distant classroom. This resource includes: Detailed teacher instructions
Subjects:
Grades:
4th - 9th
Types:
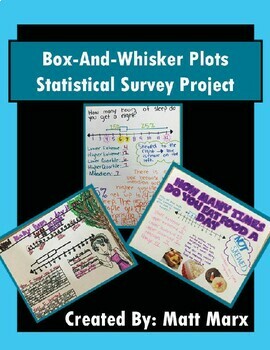
Box And Whisker Plots - Statistical Survey Project
Box-And-Whisker Plots - Statistical Survey ProjectThis Statistical Survey Project offers students the opportunity to demonstrate an understanding of Statistics content through the lens of a personalized statistical survey and the creation/study of a Box-And-Whisker Plot.Students insert themselves into their learning by selecting their own personalized survey question. Students have fun creating their posters, sharing them with the class, and having them displayed for all to see in the classroom.
Subjects:
Grades:
6th - 12th, Higher Education, Adult Education
Types:
CCSS:
Statistics In My World Project
This is a great project for students to do at the beginning of a HS statistics class. It will open their eyes to statistics in the media and provides real world interpretation of material learned the first couple weeks of class. The best part - You get lots of decorations for your wall and material to use as you progress through descriptive statistics!
Package includes instructions for teacher, including CCSM standards and objectives; student handout outlining specifics of the project; gradi
Subjects:
Grades:
11th - 12th
Probability project using Real-World March Madness Tournament
Jump into the March Madness tournament to apply probability concepts to a real-world application. Great for your sports-loving students. Students explore probability first by determining the probability that a team will win. Students, further, weight teams based on historical data and/or team statistics. This mini-project allows for creative problem-solving and has some open-ended answers.Included in this resource:★ Student pages for 3 March Madness related activities★ Detailed guidelines fo
Subjects:
Grades:
7th - 10th
Types:
Also included in: 7th Grade Math Resource Bundle

Statistics Survey Project - Project Based Learning (PBL) with Math
Watch your students dive into the world of math as they create, execute, and analyze their own survey! Students will demonstrate mastery of data gathering, survey sampling, developing appropriate survey questions, data tables, Direct Variation, discrete graphs, dot plots, box and whisker graphs, and calculating the inter-quartile range.The Unique Survey Project is highly engaging, capitalizing on the innate curiosity of the adolescent mind. You will love the low-prep instructional guide. Your st
Subjects:
Grades:
6th - 10th
Types:
Also included in: Fun with Ratios Activities Bundle - 7th Grade PBL with Math
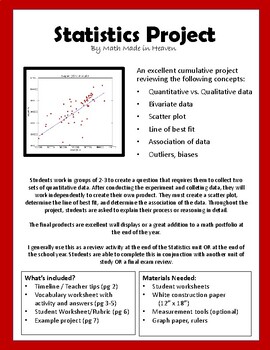
Statistics Project: scatter plot, line of best fit, association of data
An excellent cumulative project reviewing the following concepts: •Quantitative vs. Qualitative data•Bivariate data•Scatter plot•Line of best fit•Association of data (strong, weak, linear, non-linear, positive, and negative)•Outliers, biases, population, sample groupStudents work in small groups to create a question that requires them to collect two sets of quantitative data. After planning and conducting the experiment and collecting data, they will work independently to create their own produc
Subjects:
Grades:
7th - 10th
Types:
Statistics Group Project (8.SP.1, 8.SP.2, 8.SP.3, 8.SP.4)
This group project assesses student knowledge on the following concepts:
-scatter plots
-correlation
-correlation coefficient (using a calculator)
-trend lines and using trend line equations to predict values
-two-way tables
-two-way tables using relative frequency (total, rows, columns)
-identifying trends in two-way tables
-using two-way tables to answer questions
Included:
-Project instruction sheet for students
-Rubric
-Example project to show students (powerpoint)
-handout on using a calcu
Subjects:
Grades:
8th - 9th
Types:
March Madness Math Statistics Activity
Students will choose their own team in the March Madness tournament and find the data landmarks for the points that team scored throughout the year. Students will also be asked to create a histogram using the points the team scored throughout the year.
*One modification - If you prefer you can give your students a few teams to pick from instead of allowing them to choose ANY team.
Subjects:
Grades:
5th - 12th
Types:
Showing 1-24 of 350+ results


