TPT
Total:
$0.00
Selected
Subjects
23 results

High school math laboratories for Microsoft Excel
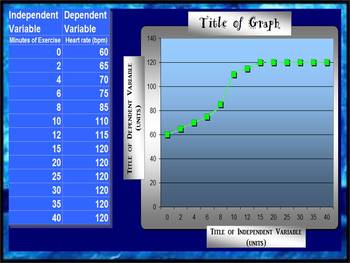
Preview of LINE GRAPH MAKER (AUTOMATIC)

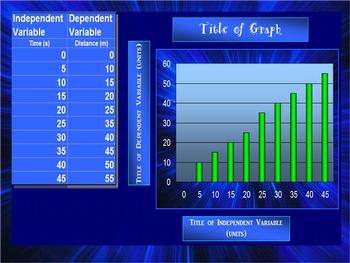
LINE GRAPH MAKER (AUTOMATIC)

Created by
Science Girl
This spreadsheet allows you to insert your independent and dependent variables into a chart and voila!... a line graph is generated as you enter in each piece of new data! Students love to take their data from a lab and watch as a graph is made right before their eyes! You can change all of the titles on the chart and the graph to suit your classes laboratory experiment needs! Students can easily print out their data to include in their lab reports!
Preview of EDITABLE Excel Graphing Template

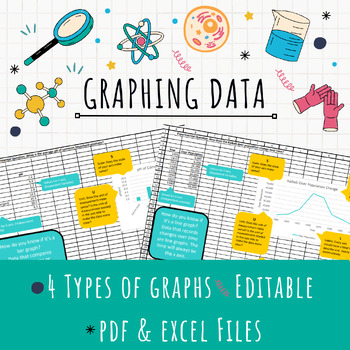
EDITABLE Excel Graphing Template

Teach graphing in Excel with this EDITABLE template! After collecting data, have your students represent it in a formal graph using Excel. This template provides helpful tips for students to determine the right kind of graph (bar, line, or pie) for their data and ALSO teaches them all the important parts of a graph.Assign the template for students to download and edit for a quick graphing solution or provide the pdf handouts for students who just need a little guidance!4 different kinds of graph
Preview of How To Graph Using Google Spreadsheets
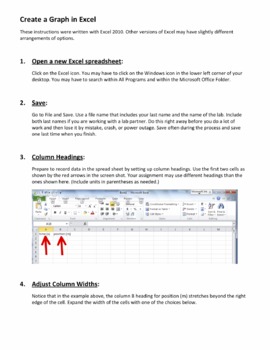
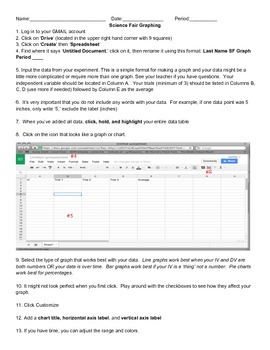
How To Graph Using Google Spreadsheets

This is a step-by-step guide on how to use Google Spreadsheets for students in grades 5-12. Use this as a resource when guiding students through the process. Included with the directions is sample data for students to use when practicing graphing. Perfect for science experiments and science fair!
Preview of Create Line Graphs in Excel

Create Line Graphs in Excel

Created by
David Baxter
This instruction guide walks students (and us teachers) through the process of entering data into an Excel spreadsheet and turning it into a line graph. This 10-page guide contains numerous screen shots to help explain each step. The guide can be used along with laboratory investigations and projects common to physics, chemistry, and biology, as well as courses in mathematics, economics, meteorology, sociology, etc. If your students need to learn how to graph the data they collect, this guide w
Preview of BAR GRAPH (AUTOMATIC)

BAR GRAPH (AUTOMATIC)

Created by
Science Girl
This spreadsheet allows you to insert your independent and dependent variables into a chart and voila!... a bar graph is generated as you enter in each piece of new data! Students love to take their data from a lab and watch as a graph is made right before their eyes! You can change all of the titles on the chart and the graph to suit your classes laboratory experiment needs! Students can easily print out their data to include in their lab reports! elementary science class, middle school sc
Preview of Solving Triangles using Excel (Editable)

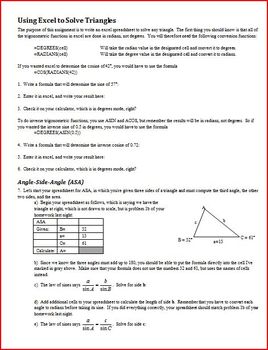
Solving Triangles using Excel (Editable)

Created by
Peter Jonnard
I think that when we use technology in the classroom with our students, we should teach them to use technology as a tool. One of the best applications for using a spreadsheet in class is in the solution of triangles. After my students have mastered the laws of sines and cosines with handheld calculators, and are familiar with the ambiguous case, I have them redo the same problems using excel. It is a very challenging activity for them. NOTE: Your students will need to have access to a comp
Preview of Homeostasis Heart Rate Lab

Homeostasis Heart Rate Lab

Created by
Andrew Dunn
This lab can be used for middle school sciences, any Biology-based science class, or mathematics statistics classes. Included are a word document with instructions, lab, an excel spreadsheet with example data, a blank sheet with formulas that will calculate data, and a PowerPoint with student instructions.
Preview of Automatic Bar Graph Maker

Automatic Bar Graph Maker

Created by
Science Girl
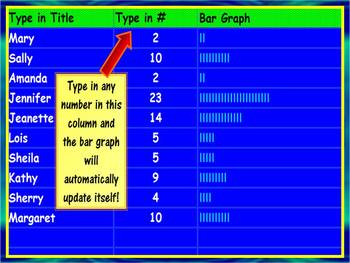
This activity can be used to teach students of all ages about bar graphs. This spreadsheet can be used to introduce the concept of bar graphs to elementary students as well as implemeted by mid-level & high school students in lab reports and/or presentations. It is extremely quick and easy to use! Just type in a set of numbers and it automatically creates a simple bar graph. And check out my other graph templates for line and bar graphs! They are definately worth your time!
Preview of Pi activity for High School students

Pi activity for High School students

Created by
Oz
Determining the value of π experimentallyIn this activity, students use circular objects to find the value of pi (π) experimentally. It can be used as a lab activity in Science classes where students practice their data collection and graphing skills. OR, math teachers can use it as an activity for Pi Day. The activity goes over two methods to plot the data collected: MS Excel and graph paper. For students who have not mastered MS Excel graphing skills yet, the activity involves a link that help
Preview of Hooke's Law graphing lab

Hooke's Law graphing lab

Created by
John Spaulding
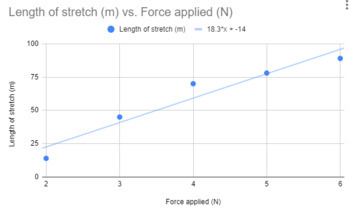
Simple STEM focussed activity to teach Hooke's law. Students will collect data, and analyze it graphically. The lab looks at solving Hooke's law problems by graphing data and then using the graph to solve problems about each specific spring. Some basic spreadsheet skills are also taught with this exercise, as students use Google sheets to develop and analyze their graphs.There is minimal set-up required, and not much equipment is needed. Teachers will only need 5 different "springs" (rubber band
Preview of Creating Frequency Tables and Histograms in MS Excel 2007

Creating Frequency Tables and Histograms in MS Excel 2007

Created by
Veronica Hupper
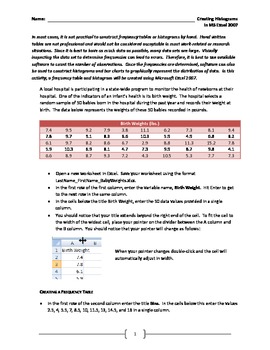
This activity looks at a realistic data set and walks the student through constructing a frequency table and histogram using Microsoft Excel. It should be noted that Excel is not the best software package for creating histograms, but because it one of, it not the most widely used software package for data storage and presentation in business, it is important to know how to create professional-looking and statistically accurate graphics using this tool. There are two different ways to constru
Preview of Chemistry Laboratory: Syringe Pumps (Enrichment Chemistry Series)

Chemistry Laboratory: Syringe Pumps (Enrichment Chemistry Series)

Created by
Peter Rony
The New Era Syringe Systems, Inc. syringe pumps are remarkable. They are perfect for grade-level 9-12, laboratory-course teachers who wish to add STEM chemical-engineering experiments. Large-scale chemical systems – e.g., oil refineries and chemical plants – are flow systems. In contrast, laboratory, small-scale chemical systems – usually round-bottom flasks – are batch systems. The value of a syringe pump is its enormous range of flow rates – as much as one-million to one -- which depend
Preview of Intro Activity: Interest Rates and Credit Scores
Intro Activity: Interest Rates and Credit Scores

An introduction activity to Interest Rates and Credit Scores.Students will be given fake money that they can buy things with in groups. Each group will have a desk card that tells them how much money they have and a number at the bottom which is their "Credit Score". You know this but they don't know it yet.Students are given a monthly payment plan based on how much they borrowed and their credit scores.Includes:1. Teacher Instructions + Tips2. Desk Cards (1 sided print and 1 per group)3. Items
Preview of Thickness of aluminum cans through density
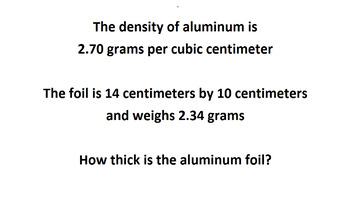
Thickness of aluminum cans through density

Created by
mrphysh
This folder includes these documents. 1 This document: contents and information for the teacher 2 FOR THE TEACHER: Density lab; This is your document for preparation and information. The preparation will take less than an hour. 3 EXERCISE Student data sheet with questions 4 ANSWERS Students data sheet with questions 5 ENRICHMENTAL SUPPLEMENTAL aluminum rolls 6 ANSWERS ENRICHMENT SUPPLEMENTAL aluminum rolls 7 The short video that was used as a preview. This is a higher quality versi
Preview of Report writing for students

Report writing for students

Created by
Peter Rony
You can view the images and hear my narration at YouTube URL https://youtu.be/7HeXCH_rDMY Copyright (C) Peter Rony 2015 All rights reserved. I am a chemical engineering educator by profession. This PDF is an important STEM activity that is targeted for teachers starting at level 3 and continuing to level 12. It is not sufficient to have just a laboratory course. As much as possible, students should obtain quantitative “data” as a result of their experiments -- and not just qualitativ
Preview of All in one conversion table

All in one conversion table

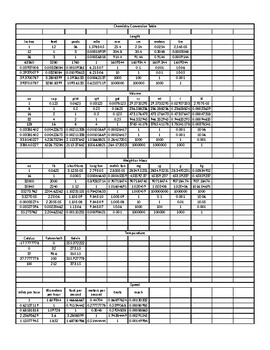
The conversion table has just about everything you need to make your daily conversions as well as the scientific conversions that are a bit tougher to do. This spreadsheet contains eight different conversion tables that are easy to use. Each conversion starts with one starting unit that is then converted to all other types of measurements within that group.
Preview of Golden ratio class activity / lab

Golden ratio class activity / lab

Created by
Oz
Determining the value of golden ratio experimentallyIn this activity, students use golden rectangles to find the value of phi (φ) experimentally. It can be used as a lab activity in Science classes where students practice their data collection and graphing skills. OR, math teachers can use it as an activity for golden ratio related topics such as Fibonacci sequence.The activity goes over two methods to plot the data collected: MS Excel and graph paper. For students who have not mastered MS Excel
Preview of Finding PI Using Excel

Finding PI Using Excel

Created by
Jo Ann Merrell
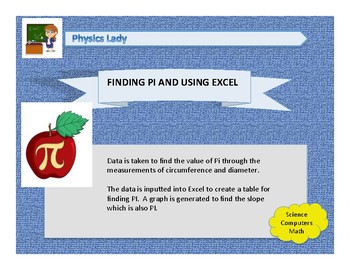
Data is taken to find the value of Pi through the measurements of circumference and diameter. The data is inputted into Excel to create a table for finding PI. A graph is generated to find the slope which is also Pi.
Preview of Scientific Thinking and Graphing: Excel Example
Scientific Thinking and Graphing: Excel Example

Created by
Christina Love
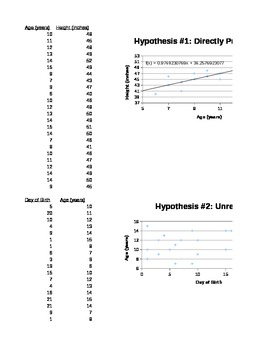
This product is an Excel example and is intended to be used with my product "Scientific Thinking and Graphing". "Scientific Thinking and Graphing" is a great activity for any math/science class and any grad (9-12 or higher education). It is a great activity to do in the beginning of the school year – IT IS A GREAT ICE BREAKER! There should be little instruction needed prior to this activity and it naturally creates student interaction. Objectives: - Students will be able to hold group discussi
Preview of Quadratic Grapher

Quadratic Grapher

Created by
Winston Noble
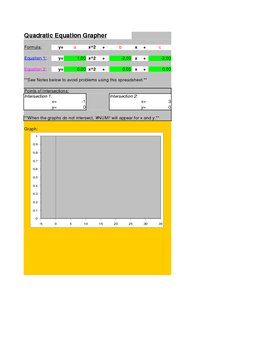
Quadratic Grapher MS Excel Spreadsheet graphs up to 2 quadratic equations / functions at a time. It is color coded so it is easy to see which parabola corresponds to which equation. It also displays 10 points. The x values can be changed to your liking. It also finds the points of intersection between the two parabolas. This is useful for solving a system of two quadratic equations. It could probably even solve a system of two equations that has one quadratic and linear equation. Just inp
Preview of Linear Grapher

Linear Grapher

Created by
Winston Noble
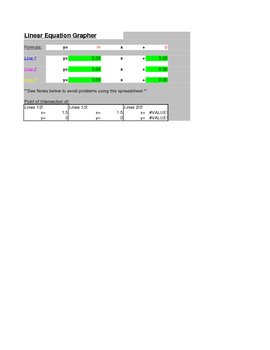
Linear Grapher Microsoft Excel Spreadsheet that allows you to graph up to 3 lines at a time. The lines are color coded with the equations, so you will know which line corresponds to which equation. It also displays 10 points for each equation. The x values for these points can be adjusted. It also finds the points of intersection for every pair of lines. This is helpful for system of equations. It also has a seperate application built into the spreadsheet for finding the equation of a line
Preview of Quadrilaterals Possible or Impossible
Quadrilaterals Possible or Impossible

Students will use the properties of quadrilaterals to decide if a figure with the given characteristics is possible or impossible to create. If it is possible, than they can use Geometer's Sketchpad or other software to create it.
Preview of Suffocation Survival Challenge

Suffocation Survival Challenge

Created by
Matt Endrizzi
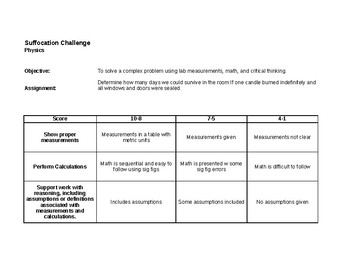
Need a lab to challenge students' measurement and significant digits skills?
Showing 1-23 of 23 results

Find Math resources | TPT

Importance of learning math skills

It's no secret that mathematics is one of the foundational subjects that students need to learn. Math forms the basis for so many other subjects — like science, engineering, and technology — and because of that, it's essential that students develop strong math skills starting from a very young age.

Benefits of learning math

Learning math has many benefits. It helps students:

  • Begin to develop problem-solving, logical reasoning, and critical-thinking skills
  • Grow their understanding of numbers and basic operations
  • Understand how math is used in real-life situations

By ensuring that students have a solid foundation, teachers can help set them up for future success.

Discover printable and digital math resources

Math resources are an integral part of effective math education. On TPT, math resources come in various forms: from worksheets and full-year curricula to manipulatives and educational games. They can be used to enhance learning, assess student’s mastery of math concepts, and engage students in meaningful learning. By incorporating math resources from TPT into your teaching toolbox, you can create a rich learning experience that strengthens students’ understanding of math concepts and encourages a positive attitude toward math.

If you’re a teacher or parent looking for printable and digital math worksheets, TPT has an extensive collection of math resources across topics and grade levels. No matter what math topic your students are working on — whether you’re teaching numbers to kindergarteners or algebra to 9th graders — TPT has resources designed to help with any math learning need.

With a little encouragement and plenty of resources, TPT resources can make teaching and learning math so much easier. Plus, you can expand students’ knowledge even further by exploring TPT science resources, which are frequently paired with math lessons.

Frequently asked questions about math resources

What types of math lessons are available on TPT?

There are many different types of math resources sold by Sellers on TPT. Some popular math lessons include geometry, mental math, algebra, fractions, place value, measurement, and decimals.

How do I find math lessons on TPT?

Educators can save time preparing math lessons with resources created by experienced teachers. Simply start a search for math resources on the TPT marketplace, and filter by grade level, price, and/or resource type to find materials that've been proven to work in classrooms like yours. No matter what you’re teaching, there are plenty of math lessons and activities sold by Sellers on TPT that are tailored to meet your students' skill levels.

How do I support students struggling with math?

If your student or child is struggling with a specific math concept, you can provide extra support and resources such as math worksheets. Sometimes, visual aids like charts, graphs, and manipulatives can help children understand abstract concepts better.

How can I make math fun?

Students learn best when they're engaged! Sprinkle a little fun into your math lessons by using educational games, videos, puzzles, and real-life scenarios. If your class seems to find math boring or uninteresting, you can also try connecting lessons to their interests or hobbies. Encourage them to ask questions and explore mathematical concepts in different ways.