156 results
Not grade specific graphing assessments
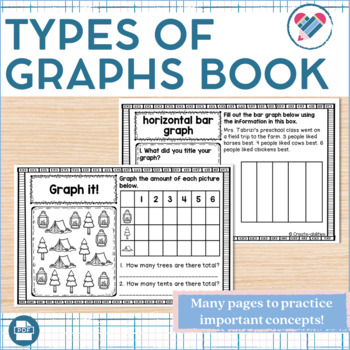
Different Types of Graphs Book
This 26 page pack gives your students many different opportunities to learn about and identify different types of graphs. They will also create and draw their own graphs. The book is half page to help with printing, copying, and stapling. The size also helps students be able to store them inside their desks or folders for easy access to this information. Teaching this important measurement concept has never been easier or more fun!Many Different Types of Charts and Graphs to Deepen Your Student'
Subjects:
Grades:
Not Grade Specific
Types:
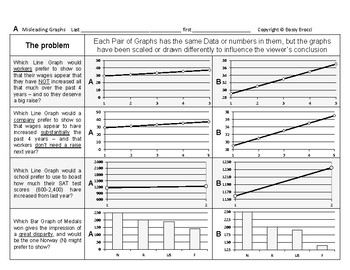
Stats&Data 14: Misleading & Misinterpreting Data Graphs Charts Statistics
This is an excerpt from my popular line ofBossy Brocci Math & Big Science workbooks on Amazon.ANSWER KEY included=======================Students will:1) Analyze 20 different Graphs or Data Displays2) Draw Conclusions & Answer questions about theaccuracy, fairness, limitations & legitimacy of those Graphs3) Answer 16 Multiple-choice questionsbased on their Calculations & Observations4) Be compelled to show their work in a neat & orderly format5) Be trained to methodically &
Subjects:
Grades:
Not Grade Specific
Types:
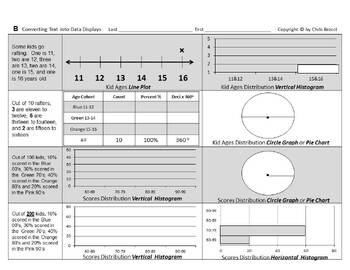
Stats&Data Bundle C: Data Displays Measures of Central Tendency & Variation
From the Author of Bossy BrocciMath & Big Science workbooks on Amazon,this Bundle of Data Displays,Measures of Central Tendency(Mean, Median, Mode & Range);and Measures of Variation(Quartiles, Interquartile Range, Outliers & Box Whisker plots)contains:11 Lessons32 Worksheets832 Problems & Tasks- and Assessment up the a$$=======================Answer KEYS included=======================Coverage Specifics:#1 Identify & Select Common Typesof Data DisplaysStudents will:1) Identi
Subjects:
Grades:
Not Grade Specific
Types:
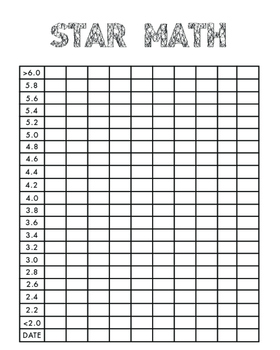
STAR Math Data Tracker
Students track their grade equivalent (GE) of their STAR Math test in this bar graph. This data tracker is based on the Renaissance Learning program STAR Math.
These data trackers are great for Student-led conferences! In my 4th grade class, my students have Student Data binders filled with my data tracking sheets & lots of other resources!
Subjects:
Grades:
Not Grade Specific
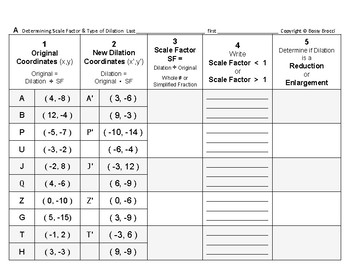
Transformations 16: Dilations - Calculate Scale Factors & Write Type of Dilation
This is an excerpt from my popular line ofBossy Brocci Math & Big Science workbooks on Amazon.Answer KEY included=======================Students will:1) Calculate and Write 10 Missing Scale Factorsfrom NON-graphical (i.e. just numerical) Original and Dilation Coordinates2) Convert Scale Factors to eitherWhole Numbers or Simplified Fractions3) Determine and Write whether‘Scale Factor is < 1’ or ‘Scale Factor is > 1’4) Determine and Write if the Dilation is a‘Reduction’ or ‘Enlargement’5
Subjects:
Grades:
Not Grade Specific
Types:
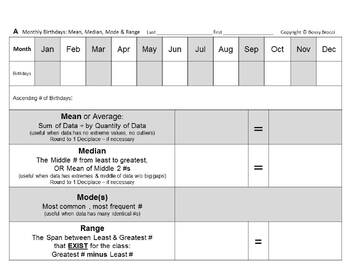
Stats&Data Bundle B: Birthdays Data Displays Variation Mean Median Mode Range
From the Author of Bossy BrocciMath & Big Science workbooks on Amazon,this Birthdays Stats (Mean, Median, Mode, Range),Measures of Variation & Data Displays Bundlecontains:2 Lessons12 Worksheets294 Problems & Tasks- and Assessment up the a$$=======================Answer KEY included=======================Coverage Specifics:#1 Author's Numbers Birthdays ProjectStudents will:1) Convert the given Monthly Birthdaysfrom Mr. Brocci's School numbers into:Ascending List/Data SetMeanMedianMod
Subjects:
Grades:
Not Grade Specific
Types:
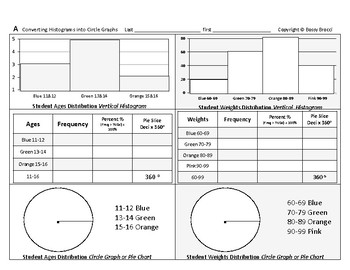
Stats&Data 03: Convert Histograms into Circle Graphs Construct Create Pie Charts
This is an excerpt from my popular line ofBossy Brocci Math & Big Science workbooks on Amazon.Answer KEY included=======================Students will:1) Convert 3 Vertical Histograms into3 Data Tablesand3 Colored or Shaded Circle Graphs (Pie Charts)2) Convert 1 Horizontal Histogram into1 Data Tableand1 Colored or Shaded Circle Graph (Pie Chart)3) Be compelled to show their work in a neat & orderly format4) Be trained to methodically & systematicallyPresent Data in different DisplaysN
Subjects:
Grades:
Not Grade Specific
Types:
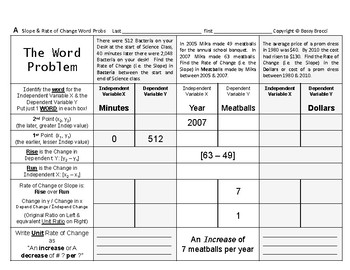
Pre-Graphing 17: Calculate Slope as a Rate of Change from Word Problems
This is an excerpt from my popular line ofBossy Brocci Math & Big Science workbooks on Amazon.====================Students will:1) Solve 6 Rate of Change or Slope Word Problems by identifying & Writing the Independent and Dependent-Variable Data pairs or Points, and Solving for Rate of Change using the 2-Point Slope Formula2) Write the Unit Rate of Change as a Complete Sentence 3) Be compelled to show their work in a neat & orderly format4) Be trained to solve Rate of Change Word Pro
Subjects:
Grades:
Not Grade Specific
Types:
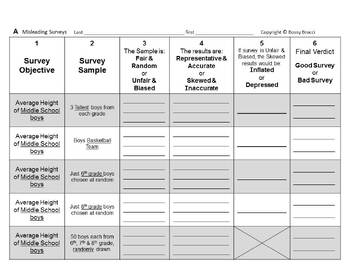
Stats&Data Bundle D: Misleading Misinterpreting Surveys Statistics Graphs Charts
From the Author of Bossy BrocciMath & Big Science workbooks on Amazon,this Bundle onMisleading & MisinterpretingSurveys, Statistics, and Graphs/Chartscontains:2 Lessons8 Worksheets78 Problems & Tasks- and Assessment up the a$$=======================Answer KEYS included=======================Coverage Specifics:#1 Misleading & Misinterpreting Surveys & Statistics+ QUIZStudents will:1) Read 10 different Surveys and Survey Samples2) Determine and Write if those Surveys are:Fair
Subjects:
Grades:
Not Grade Specific
Types:
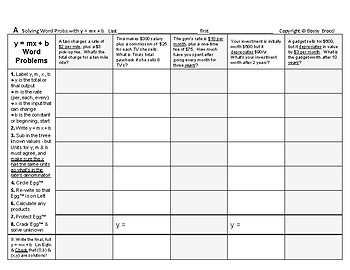
Graphing Linear Equations 11: Use Slope Intercept y = mx + b Solve Word Problems
This is an excerpt from my popular line ofBossy Brocci Math & Big Science workbooks on Amazon.====================Students will:1) Write 20 Slope-Intercept linear equationsfrom 20 Word Problems2) Solve for y 5 times, m 5 times,x 5 times & b 5 times3) Be compelled to show their work in a neat & orderly format4) Use the Bossy Brocci "Egg" method for solving algebraic equations5) Be compelled to show their work in a neat & orderly format6) Be trained to solve algebraic equations met
Grades:
Not Grade Specific
Types:
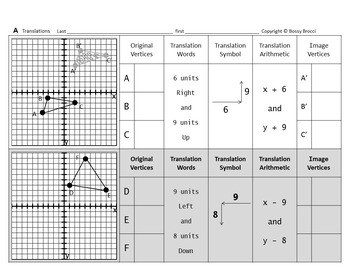
Transformations MEGA Bundle E: Translations Reflections Rotations Dilations
Spun-off from my popular series of Bossy Brocci Math & Big Science Workbooks on Amazon,this Transformations MEGA Bundle onTranslations, Reflections, Rotations & Dilationscontains:5 Units22 Lessons81 Worksheets1,118 Problems & Tasks- and Assessment up the a$$=======================This Transformations MEGA Bundle containsALL 4 Sub-bundles A, B, C & D within it:A Translations BundleB Reflections BundleC Rotations BundleD Dilations Bundleplusthe Summary of Transformation Properti
Grades:
Not Grade Specific
Types:
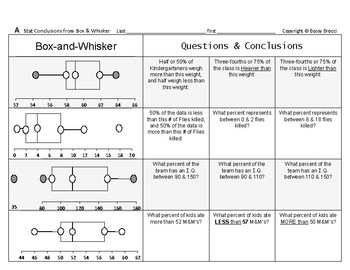
Stats&Data 09: Draw Statistical Conclusions from Box and Whisker Box Plots QUIZ
This is an excerpt from my popular line ofBossy Brocci Math & Big Science workbooks on Amazon.Answer KEY included=======================Students will:1) Analyze 8 Box & Whisker Plots (Box Plots)2) Answer at total of 24 questionsfrom those Plots regarding variousFraction & Percent Distribution portions3) Be compelled to show their work in a neat & orderly format4) Be trained to methodically & systematicallyTranslate or Convert Box & Whisker Plotsinto Fractions & Percen
Subjects:
Grades:
Not Grade Specific
Types:
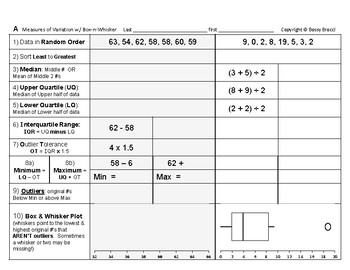
Stats&Data 06: Variation Quartiles Interquartile Range Outliers Box Whisker Plot
This is an excerpt from my popular line ofBossy Brocci Math & Big Science workbooks on Amazon.Answer KEY included=======================Students will:1) Sort or Sequence 8 different Data Sets or Sets of Numbers2) Calculate & Identify for each of the 8 Data Sets the:MedianUpper QuartileLower QuartileInterquartile RangeOutlier ToleranceAllowed MinimumAllowed Maximumandany Outliers3) Draw or Construct the Box and Whisker Plots (Box Plots)directly beneath their calculations4) Be compelled to
Subjects:
Grades:
Not Grade Specific
Types:
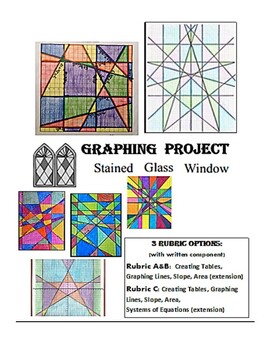
Graphing Linear Art Project/Activity (3 rubrics ALL Grades) No Prep STEM
Make graphing masters with this fun, graphing lines art project. With 3 different rubrics for all grades and abilities, have student practicing horizontal, vertical and linear equation lines along with extra credit opportunities of finding area of shapes. Topics covered, slope, intercepts, using equations to find points, geometry and more. Great for upper elementary, middle school and algebra students.
Grades:
Not Grade Specific
Types:
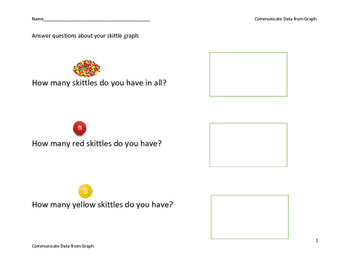
VAAP Graphing - Skittles (Bar graph template and questions)
Fun and engaging activity appropriate for:
VAAP Math: PROBABILITY, STATISTICS, PATTERNS, FUNCTIONS, AND ALGEBRA 3M-PSPFA 1 (b) or (c)
OR
VAAP Science: SCIENTIFIC INVESTIGATION 3S-SI 1 (h) or 3S-SI 2 (k)
Students can color or use dot-a-dot paint to complete the bar graph. Students can write or use number stamps to answer questions about their graph.
Subjects:
Grades:
Not Grade Specific
Types:
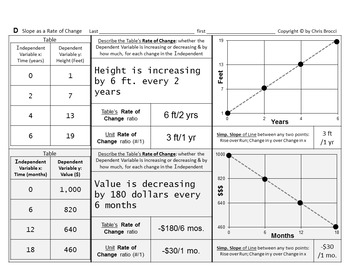
Graphing Bundle E: Calculating Graphing SLOPE as a RATE of CHANGE bundle
Welcome to my biggest-selling Math Bundle!==============================Spun-off from my popular series ofBossy Brocci Math & Big Science Workbooks on Amazon,this Bundle on Slope as a Rate of Change contains:7 Lessons22 Worksheets232 problems- and Assessment up the a$$!===========================With this bundle, your students will master Slope as a Rate of Change- forwards and backwards, inside and out.An extremely THOROUGH treatment of Slope as a Rate of Change,this Bundle might be the cl
Grades:
Not Grade Specific
Types:
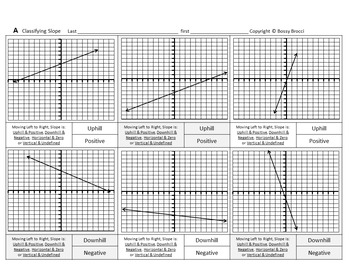
Graphing Bundle F: The SUPER Calculating & Graphing Slope bundle
Spun-off from my popular series ofBossy Brocci Math & Big Science Workbooks on Amazon,this Bundle on Slope contains:15 Lessons72 Worksheets852 Problems- and Assessment up the a$$!===========================This SUPER-SLOPE BUNDLE also contains the smaller Graphing E: "Calculating & Graphing Slope As a Rate of Change Bundle" With this Slope Super bundle, they'll master both Slope as Rise over Run, and Slope as a Rate of Change. This is the definitive product on Slope as a Numeric, Algebr
Grades:
Not Grade Specific
Types:
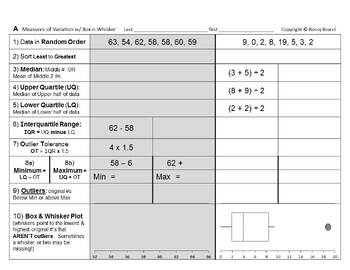
Stats&Data Bundle A: Box Whisker Box Plots & Measures of Variation bundle
Spun-off from my popular series of Bossy Brocci Math & Big Science Workbooks on Amazon,this Measures of Variation Box & WhiskerBox Plots Bundlecontains:4 Lessons10 Worksheets263 Problems & Tasks- and Assessment up the a$$=======================Answer KEYS included=======================Coverage Specifics:#1 From Quartiles Interquartile Range& Outliers to Box Whisker PlotsStudents will:1) Sort or Sequence 8 different Data Sets or Sets of Numbers2) Calculate & Identify for each
Subjects:
Grades:
Not Grade Specific
Types:
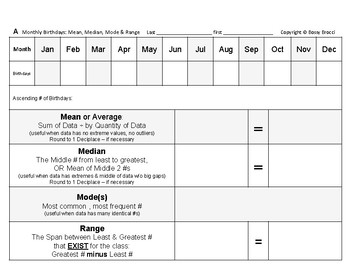
Stats&Data 11: YOUR Birthdays Variation Central Tendency Data Displays Project
This is an excerpt from my popular line ofBossy Brocci Math & Big Science workbooks on Amazon.=======================Students will:1) Convert a Monthly Birthdays tallyfrom YOUR School or Class(es)into:Ascending List/Data SetMeanMedianModeRangeUpper QuartileLower QuartileInterquartile RangeOutlier ToleranceAllowed MinimumAllowed MaximumOutliersBox & Whisker PlotVertical Bar GraphLine GraphStem & Leaf PlotLine Plot (X Plot)Data TableCircle Graph (Pie Chart)andVertical Histogram2) Be co
Subjects:
Grades:
Not Grade Specific
Types:
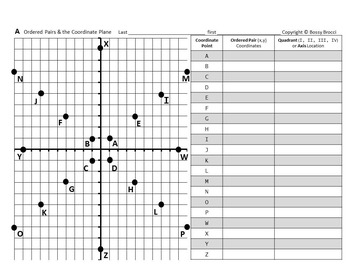
Graphing Bundle A: The BIG Pre-Graphing bundle
Spun-off from my popular series ofBossy Brocci Math & Big Science Workbooks on Amazon,this PRE-Graphing BIG Bundle contains:21 Lessons87 Worksheets1,269 problems- and Assessment up the a$$!===============================This PRE-Graphing BIG Bundle already contains the:A) Slope as a Rate of Change sub-bundleplusB) Super Slope sub-bundlewithin it!===============================Individual cost would be $111,but the Bundle price is just $80!===============================Lessons:Ordered Pairs &
Grades:
Not Grade Specific
Types:
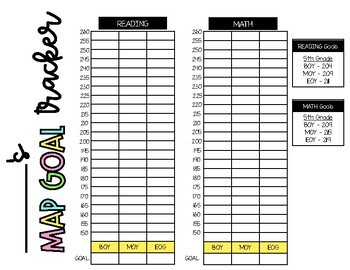
Editable NWEA/MAP Score Tracker
Students can track their MAP scores from Fall to Spring and record their goal from their MAP report to strive for!Once the MAP testing is complete, students can record their new score and shade it their growth on the graph!**I suggest printing on card stock for year-long durability.**
Subjects:
Grades:
Not Grade Specific
Types:
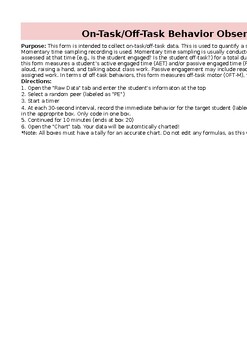
Behavior Observation Academic Engagement and Time on Task (BOSS) AUTO GRAPH
This form is intended to collect on-task/off-task data. It will AUTO graph. This is used to quantify a student's academic engagement and off-task behaviors. Momentary time sampling recording is used. This form measures a student’s active engaged time (AET) and/or passive engaged time (PET). In terms of off-task behaviors, this form measures off-task motor (OFT-M), verbal (OFT-V), and passive behaviors (OFT-P). EXCEL DOCUMENT.
Subjects:
Grades:
Not Grade Specific
Fact Fluency Tracker
This is a great tool for students to use to track their progress with their math facts!
Subjects:
Grades:
Not Grade Specific
Types:
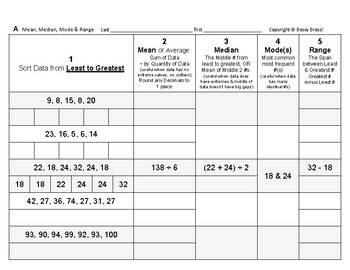
Stats&Data 05: Calculate Measures of Central Tendency Mean Median Mode & Range
This is an excerpt from my popular line ofBossy Brocci Math & Big Science workbooks on Amazon.Answer KEY included=======================Students will:1) Calculate Mean, Median, Mode and Rangefrom 10 different sets of Data or Numbers2) Be compelled to show their work in a neat & orderly format3) Be trained to methodically & systematically CalculateMeasures of Central Tendency Note: If you're looking for Box & Whisker Plots, then see my Stats&Data Lessons 06, 07, 08 and 09=====
Subjects:
Grades:
Not Grade Specific
Types:
Showing 1-24 of 156 results


