59 results
7th grade statistics outlines by TpT sellers for TpT sellers
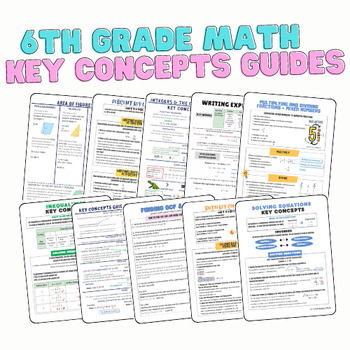
6th Grade Math: Key Concepts Guides/Anchor Charts BUNDLE
Give your students the KEY to success by purchasing this key concepts guides/anchor charts bundle. This bundle is a MUST HAVE resource for 6th grade classrooms and would also be a great one for 7th grade classrooms to have the important foundations to grow their knowledge! This bundle includes guides for ALMOST ALL 6th grade common core standards with just a few that are not addressed such as multiplying and dividing decimals using standard algorithm.Purchasing as a bundle saves you $7.50!The to
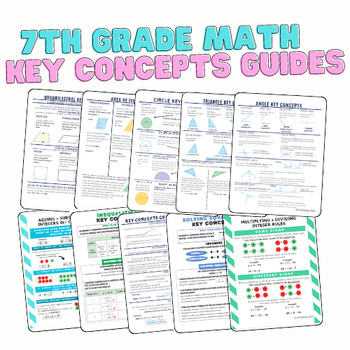
7th Grade Key Concepts Guides/Anchor Charts: BUNDLE
Give your students the KEY to success by purchasing this key concepts guides/anchor charts bundle. This bundle is a MUST HAVE resource for 7th grade classrooms and would also be a great one for 8th grade classrooms to have the important foundations to grow their knowledge!Purchasing as a bundle saves you $7.00!The topics included in this bundle are:1. Adding and Subtracting Integers2. Multiplying and Dividing Integers3. Solving and Writing Equations4. Solving and Graphing Inequalities5. Circles:
Subjects:
Grades:
6th - 8th
Types:
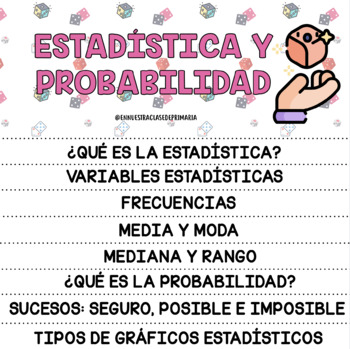
FLIPBOOK ESTADÍSTICA Y PROBABILIDAD
FLIPBOOK para trabajar los siguientes contenidos: ¿Qué es la estadística?Variables estadísticas.Frecuencias,Media y modaMediana y rango¿Qué es la probabilidad?Sucesos: seguro, posible e imposible. Tipos de gráficos.
Subjects:
Grades:
5th - 8th
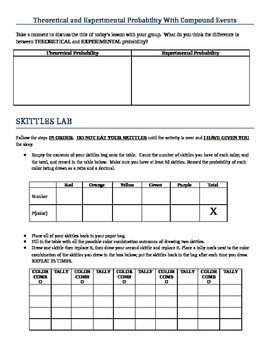
Activity for Theoretical and Experimental Probability of Compound Events
This Skittles Lab is a fun and engaging way to get students excited about finding probabilities. The experiment involves finding the theoretical and experimental probability of choosing a specific order of skittles from a bag. Students work best in groups of three to calculate their probabilities and reflect on their results. This extends what students learned about Single Event Probabilities and now involves a Compound Event. There are step-by-step instructions for students to follow through ou
Subjects:
Grades:
7th
CCSS:
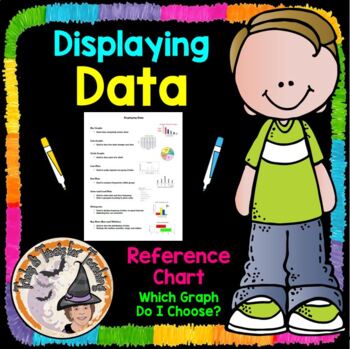
Displaying Data Reference Chart Notes Which Graph Do I Choose?
Math Teachers ~ You'll LOVE this Displaying-Data, Which-Graph-Do-I-Choose? Data-Display Reference-Chart will be SUPER helpful to your students in helping them determine which graph to choose, and provides a quick visual picture to remind them what that particular graph looks like. I printed one of these for each of my students to put inside their Math Toolkit Notebook, to use as a Reference for Data Displays Charts and Graphs. You'll enjoy using this year after year!Be sure to L@@K at my other 1
Subjects:
Grades:
5th - 8th
Find the Error - Data and Graphs with Central Tendency and Variation
This is an activity that I created for my students to find the mistake when a student has answered questions from graphs about measures of center and variation incorrectly. I used common errors to help them see the mistakes commonly made. All of my products are common core aligned.I had the students work alone to solve the problems first, and then share with their groups. If there was any discrepancy, they looked in the answer folder on their tables to see the correct answer. I rotated around
Subjects:
Grades:
5th - 7th
Which Quarterback is the G.O.A.T.? - Using Statistical Calculations
Note: This is an upgraded version of the Statistical Analysis Using Football (QB) Stats. If you have previously purchased this resource please email me and I will send you the updated version.This project has students calculate percents, averages, and ratios, as well as create scatterplots, box and whisker plots, and histogram (bar graphs) based on their calculations.Google slideshow includes 12 well know Hall of Fame quarterbacks including Joe Namath, Roger Staubach, Terry Bradshaw, Joe Montana
Subjects:
Grades:
6th - 9th
CCSS:
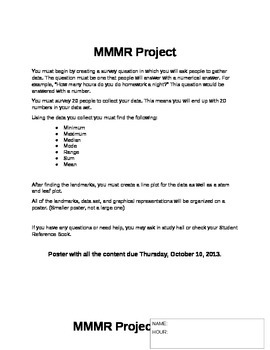
Mean, Median, Mode, and Range Project
This includes the instructions to give to the students as well as the rubric for grading the project. They must gather their own data and then complete the calculations using the data they collected.
Subjects:
Grades:
5th - 7th
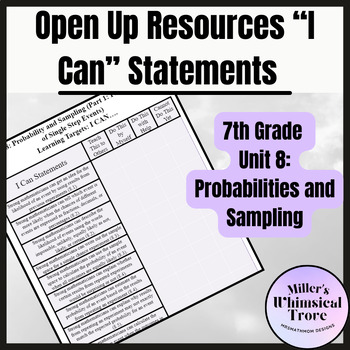
7th Grade Unit 8 Open Up Resources I Cans
This product is intended to help students self reflect on their learning revolving around the "I can's" from the Open Up Resources lessons. The students will have all the "I can's" for each lesson already on this printable document, along with the unit and lesson it's in, and four categories to help them assess their learning of the day. The four categories are "I can teach this to others," "do this by myself," "do this with help," and "cannot do this yet."This unit aligns with the Open Up Resou
Subjects:
Grades:
7th
Also included in: 7th Grade Open Up Resources I Can Statements (Units 1-8)
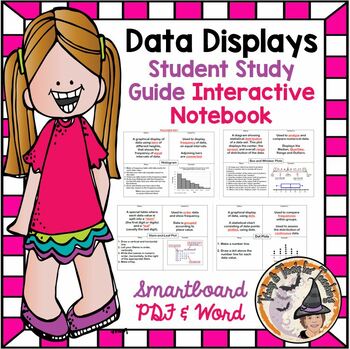
Data Displays Interactive Notes Stem Leaf Box Whiskers Histogram Dot Plots
Teachers ~ You'll LOVE these Interactive Notes that covers the following 4 data displays; Stem and Leaf Plot, Box and Whisker Plot, Histogram, and Dot Plot. The zipfile contains the Teacher's KEY version along with the Student's Fill in the Blank outline for Note Taking. You get BOTH the Students' Notes and the Teacher's KEY in both Word and Pdf formats for easy printing, along with Smartboard slides of everything as well. You'll LOVE using this year after year! Be sure to L@@K at my other 1,285
Subjects:
Grades:
5th - 7th, Staff
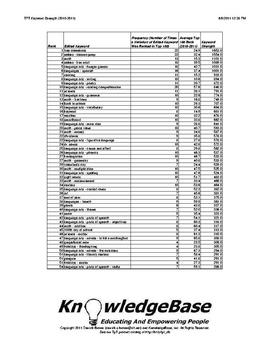
TPT KeyWord Strength Index (2010-2011) - Downloadable Spreadsheet!
What are the strongest keywords on TpT?
1. free downloads
2. Deanna Jump
3. math
Neither #1 nor #2 are surprises, but #3 (math) was certainly a surprise to me!
This report analyzes TpT's 2010-2011 keywords using a measure called "keyword strength".
The measure is based on a keyword's average rank, as well as the number of times it appeared in the 2010-2011 "Top 100" TpT search engine rankings.
This can be a valuable tool to help sellers understand TpT's marketplace supply and demand!
The P
Subjects:
Grades:
PreK - 12th, Higher Education, Adult Education, Staff
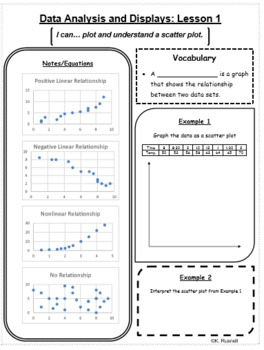
Data Analysis and Displays Notes
These guided notes are created to help differentiate and guide instruction for the math curriculum. This set of notes has been written based off of 8th grade standards and follows the Big Ideas Curriculum, but can be used for similar grades. Each page of notes includes an "I can" statement, vocabulary, student notes, step-by-step guides, examples, and story problems. Each notes is reduced to one page for quick reference. The vocabulary cards that go along with the vocabulary within the notes can
Subjects:
Grades:
6th - 10th
Types:
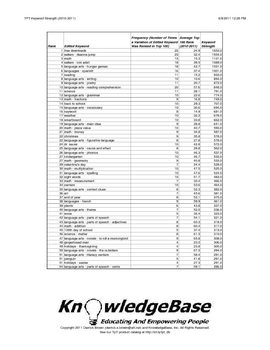
TPT KeyWord Strength Index (2010-2011) - Downloadable PDF!
What are the strongest keywords on TpT?
1. free downloads
2. Deanna Jump
3. math
Neither #1 nor #2 are surprises, but #3 (math) was certainly a surprise to me!
This report analyzes TpT's 2010-2011 keywords using a measure called "keyword strength".
The measure is based on a keyword's average rank, as well as the number of times it appeared in the 2010-2011 "Top 100" TpT search engine rankings.
This can be a valuable tool to help sellers understand TpT's marketplace supply and demand!
The P
Subjects:
Grades:
PreK - 12th, Higher Education, Adult Education, Staff
7th Grade Common Core Probability and Statistics Unit
Probability and Statistics Unit for 7th Grade Math Common Core
Lessons include:
Mean, Median, Mode, and Range
When to Use Each Measure
Mean Absolute Deviation - How to Calculate
Mean Absolute Deviation - Analysis
Sampling and Biased Surveys
Making Predictions from Survey Results
Simple Probability (Single Event)
Compound Probability - Independent Events
Compound Probability - Dependent Events
Subjects:
Grades:
6th - 8th
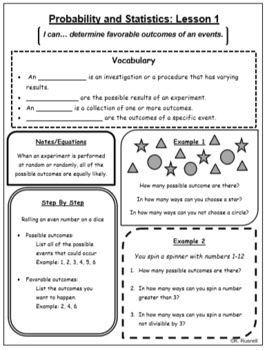
Probability and Statistics
These guided notes are created to help differentiate and guide instruction for the math curriculum. This set of notes has been written based off of 7th grade standards and follow the Big Ideas Curriculum, but can be used for similar grades. Each page of notes includes an "I can" statement, vocabulary, student notes, step-by-step guides, examples, and story problems. Each notes is reduced to one page for quick reference. The vocabulary cards that go along with the vocabulary within the notes can
Subjects:
Grades:
6th - 8th
Types:
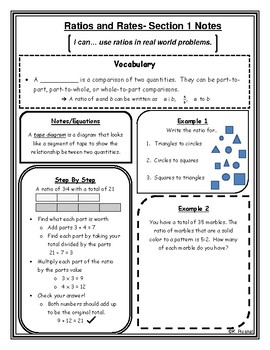
Ratios and Rates Notes
These guided notes are created to help differentiate and guide instruction for the math curriculum. This set of notes has been written based off of 6th grade standards, but can be used for similar grades. Each page of notes includes an "I can" statement, vocabulary, student notes, step-by-step guides, examples, and story problems. Each notes is reduced to one page for quick reference. The vocabulary cards that go along with the vocabulary within the notes can be found on my page as, "Math Vocabu
Subjects:
Grades:
5th - 8th
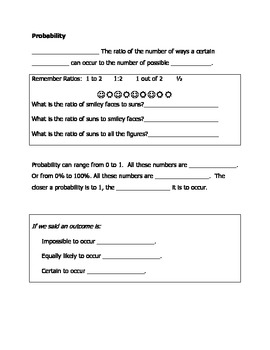
Interactive Notebook Probability Guided Notes: Theoretical vs Experimental
Guided notes discussing the concepts of Probability as a ratio, fraction, and percent. Further discussion compares Theoretical and Experimental Proability, the definitions, and forumulas to calculate. For 5th - 8th grade general education or special education classrooms. Great for your interactive notebooks.
Subjects:
Grades:
4th - 9th
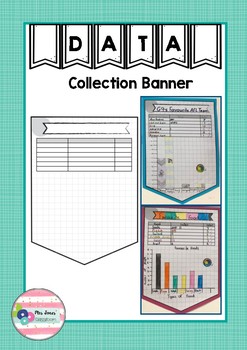
Data Collection Banner
Are your students collecting their own data and representing it using a graph this term? Then why not get them presented on this banner pendant and display them in your room.
Subjects:
Grades:
1st - 10th
Types:
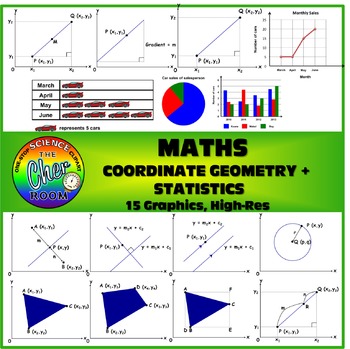
MATH Clipart: Coordinate Geometry and Statistics
15 Graphics on Coordinate Geometry and Statistics
You'll find diagrams that illustrates the following:
Gradient
Mid Point
Point at a ratio
Area of geometry
pi chart
pictogram
bar chart
line graph
This product is allowed for both personal and commercial use, but credit must be given to my store: https://www.teacherspayteachers.com/Store/The-Cher-Room
Subjects:
Grades:
7th - 12th
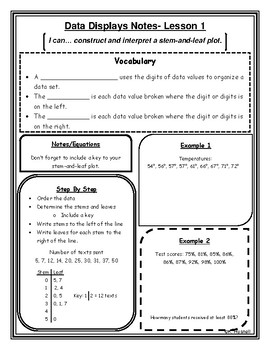
Data Displays Notes
These guided notes are created to help differentiate and guide instruction for the math curriculum. This set of notes has been written based off of 6th grade standards, but can be used for similar grades. Each page of notes includes an "I can" statement, vocabulary, student notes, step-by-step guides, examples, and story problems. Each notes is reduced to one page for quick reference. The vocabulary cards that go along with the vocabulary within the notes can be found on my page as, "Math Vocabu
Subjects:
Grades:
5th - 8th
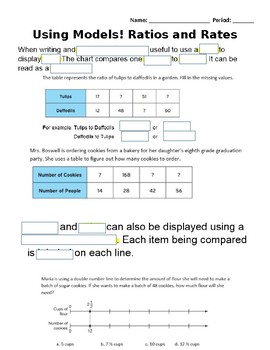
Using Models to Represent Ratios, Rates and Unit Rates Scaffold Notes
Students will use these fill in the blank notes to guide them through the Smartboard lesson on Models for ratios, rates and unit rates (located in store). Each page of the lesson is a screen shot with missing words. Students will fill in the blank and answer practice problems on handout. There is a lot an answer doc with the missing words filled in for any students with accommodations.
Subjects:
Grades:
5th - 7th
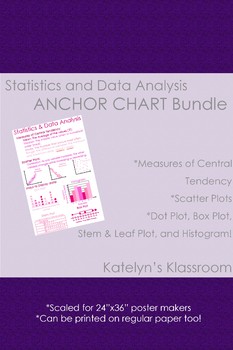
Statistics & Data Analysis Anchor Chart
Perfect anchor chart to help your students process Algebraic concepts. Scaled to print to a 36"x24" poster on a poster maker, but can be printed on a regular size piece of paper too! Allows your students to focus on the topics at hand and have examples to guide their learning!Buy an individual anchor chart, or buy the bundle with all of the algebra concepts!Concepts included on this chart:*Measures of Central Tendency*Scatterplots*Box Plot*Dot Plot*Histogram*Stem & Leaf Plot
Subjects:
Grades:
7th - 12th
Also included in: Algebra Anchor Chart BUNDLE!
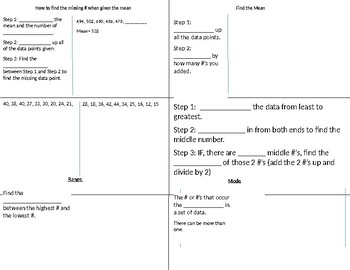
mean median mode range foldable
This foldable has cloze notes for mean, median, mode, and range. Students can fill this out and use is as a great reference.
Subjects:
Grades:
5th - 7th
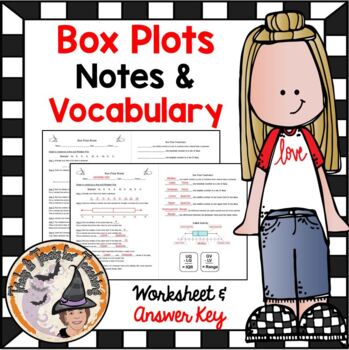
Box and Whisker Plots Notes and Practice Worksheet with Answer Key
Math Teachers ~ You'll love this AMAZING Box-and-Whisker-Plots-Notes-and-Practice, 2 page pdf where students take notes and practice creating and labeling a Box-Plot. The Zipfile contains the 2 page pdf printable worksheet and the 2 page Answer KEY. You'll LOVE using this year after year to introduce and practice Box Plots. This can be used as a Guided Practice, Math Station, Homework, or Independent Work. Answer KEY included. Learn to love teaching this skill with this terrific resource that st
Subjects:
Grades:
6th - 7th
Also included in: Box & Whisker Plots Smartboard Slides Notes Worksheet BUNDLE
Showing 1-24 of 59 results


