35 results
7th grade statistics cultural activities by TpT sellers for TpT sellers
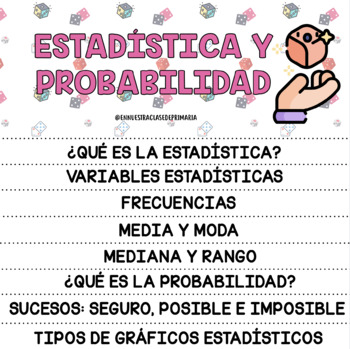
FLIPBOOK ESTADÍSTICA Y PROBABILIDAD
FLIPBOOK para trabajar los siguientes contenidos: ¿Qué es la estadística?Variables estadísticas.Frecuencias,Media y modaMediana y rango¿Qué es la probabilidad?Sucesos: seguro, posible e imposible. Tipos de gráficos.
Subjects:
Grades:
5th - 8th
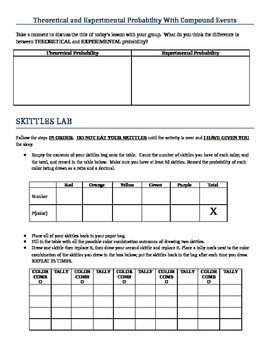
Activity for Theoretical and Experimental Probability of Compound Events
This Skittles Lab is a fun and engaging way to get students excited about finding probabilities. The experiment involves finding the theoretical and experimental probability of choosing a specific order of skittles from a bag. Students work best in groups of three to calculate their probabilities and reflect on their results. This extends what students learned about Single Event Probabilities and now involves a Compound Event. There are step-by-step instructions for students to follow through ou
Subjects:
Grades:
7th
CCSS:

Fun Statistics Research Survey Project | Standards-Based | Math 9 BC
This is a great math project to add to a unit on data and statistics. It is a great way for students to do a project on something that is important to them and they get a chance to present their individual work, which is rewarding.Description:Tell students they will be conducting a survey on. They should pick a topic and question that has some significance to them, their family, or their culture. Students will:Write a research question and a prediction. Describe the population, sampling techni
Subjects:
Grades:
7th - 11th
Find the Error - Data and Graphs with Central Tendency and Variation
This is an activity that I created for my students to find the mistake when a student has answered questions from graphs about measures of center and variation incorrectly. I used common errors to help them see the mistakes commonly made. All of my products are common core aligned.I had the students work alone to solve the problems first, and then share with their groups. If there was any discrepancy, they looked in the answer folder on their tables to see the correct answer. I rotated around
Subjects:
Grades:
5th - 7th
Which Quarterback is the G.O.A.T.? - Using Statistical Calculations
Note: This is an upgraded version of the Statistical Analysis Using Football (QB) Stats. If you have previously purchased this resource please email me and I will send you the updated version.This project has students calculate percents, averages, and ratios, as well as create scatterplots, box and whisker plots, and histogram (bar graphs) based on their calculations.Google slideshow includes 12 well know Hall of Fame quarterbacks including Joe Namath, Roger Staubach, Terry Bradshaw, Joe Montana
Subjects:
Grades:
6th - 9th
CCSS:
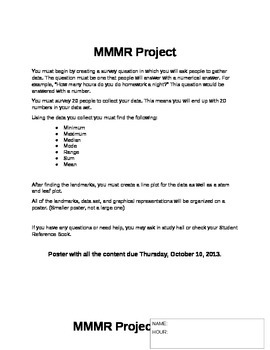
Mean, Median, Mode, and Range Project
This includes the instructions to give to the students as well as the rubric for grading the project. They must gather their own data and then complete the calculations using the data they collected.
Subjects:
Grades:
5th - 7th
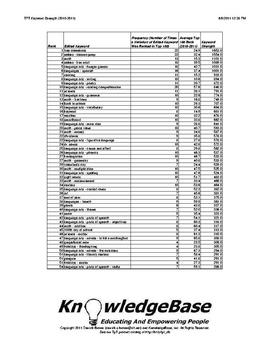
TPT KeyWord Strength Index (2010-2011) - Downloadable Spreadsheet!
What are the strongest keywords on TpT?
1. free downloads
2. Deanna Jump
3. math
Neither #1 nor #2 are surprises, but #3 (math) was certainly a surprise to me!
This report analyzes TpT's 2010-2011 keywords using a measure called "keyword strength".
The measure is based on a keyword's average rank, as well as the number of times it appeared in the 2010-2011 "Top 100" TpT search engine rankings.
This can be a valuable tool to help sellers understand TpT's marketplace supply and demand!
The P
Subjects:
Grades:
PreK - 12th, Higher Education, Adult Education, Staff
White Supremacy and Confederate Monuments Timeline Activity
This is an activity that uses data collected by the Southern Poverty Law Center tracking the use of Confederate symbols in the form of monuments, courthouses, schools, and other public amenities, including parks, highways and holidays.
The activity takes place in 3 parts:
The first part is that students assemble and label a timeline that tracks the rise of Confederate symbols from 1860 to the present day (2016.)
In the second part, students match dates to 10 different events in Civil Rights h
Subjects:
Grades:
5th - 12th
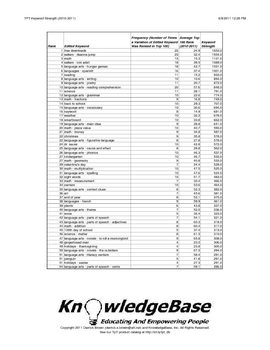
TPT KeyWord Strength Index (2010-2011) - Downloadable PDF!
What are the strongest keywords on TpT?
1. free downloads
2. Deanna Jump
3. math
Neither #1 nor #2 are surprises, but #3 (math) was certainly a surprise to me!
This report analyzes TpT's 2010-2011 keywords using a measure called "keyword strength".
The measure is based on a keyword's average rank, as well as the number of times it appeared in the 2010-2011 "Top 100" TpT search engine rankings.
This can be a valuable tool to help sellers understand TpT's marketplace supply and demand!
The P
Subjects:
Grades:
PreK - 12th, Higher Education, Adult Education, Staff

Social Justice in Math BUNDLE--NEW
Here are SIX middle school worksheets that incorporate the concepts of social justice. Teachers can model equality and equity while doing math. Here is a way to get started! NEW WORKSHEETS ADDED! (each worksheet is also available individually).
Subjects:
Grades:
6th - 10th
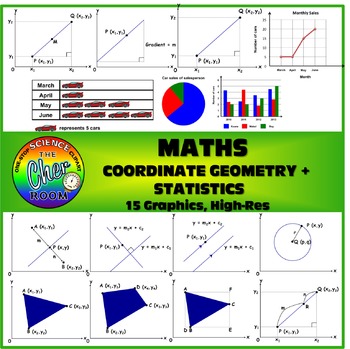
MATH Clipart: Coordinate Geometry and Statistics
15 Graphics on Coordinate Geometry and Statistics
You'll find diagrams that illustrates the following:
Gradient
Mid Point
Point at a ratio
Area of geometry
pi chart
pictogram
bar chart
line graph
This product is allowed for both personal and commercial use, but credit must be given to my store: https://www.teacherspayteachers.com/Store/The-Cher-Room
Subjects:
Grades:
7th - 12th
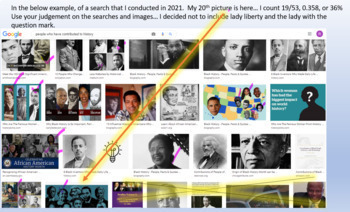
Women's History Month Probability Project
Students learn about suffrage and representatio of women. Students conduct Google searches on favorite subject, sport/hobby, future career and find the probability of a woman appearing in the first 20 images. Students make conjectures about representation of women in those areas. Students identify women they admire and create a video summarizing their findings.Can be adapted to images for African Americans for Black History Month, Hispanic Americans for Hispanic Heritage Month, etc.
Subjects:
Grades:
6th - 12th, Adult Education, Staff
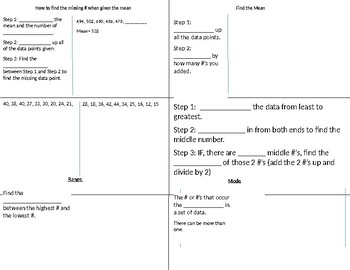
mean median mode range foldable
This foldable has cloze notes for mean, median, mode, and range. Students can fill this out and use is as a great reference.
Subjects:
Grades:
5th - 7th
Dice Bulletin Board Letters
These dice themed alphabet letter will brighten up your bulletin board display. All 26 alphabet letters are included in an uppercase font, as well as numerals 0-9 and punctuation. Letters are approximately 6 inches tall. Just print what you need and enjoy. Be sure to check out my other fun, themed letters in my store.
Subjects:
Grades:
PreK - 12th, Higher Education, Adult Education, Staff
Statistics Vocabulary TEKS Aligned
This product includes several vocabulary words for a statistics unit. There are three graphs that will be able to cut and match, along with definitions of vocabulary words.
This is aligned with the Texas TEKS
6.12B 6.12C 6.12D 6.13B
I hope this can be useful to you and your students!
Stop by my store for some free fonts!
S&S Designs
https//www.teacherspayteachers.com/Store/S-And-S-Designs
Subjects:
Grades:
6th - 9th
Dreidel Game for Fun and Ratios
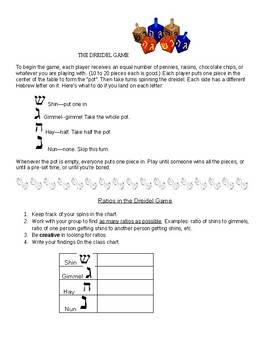
Here is a great way to practice ratios, have fun and learn about another culture. Great to use at Hanukkah time or any time of the year. This worksheet and class chart teaches the students how to play dreidel and then instructs them to practice finding and writing ratios as they play. Dreidels are available inexpensively on the internet, and you only need one per group of students.
Grades:
5th - 8th

Probability Scavenger Hunt (with a Finale about Activist Medgar Evers)
Students will love getting out of their seats to solve problems related to permutations and probabilities of independent and dependent events! The self-checking nature of this scavenger hunt makes it super-easy to run this activity and to tell if students understand the content. You don't have to do any work - just print the signs and hang them. The student solution sheet includes an interesting historical application related to Medgar Evers - students will determine the probability of his m
Subjects:
Grades:
6th - 12th
Iditarod Mean, Median, Mode, and Range
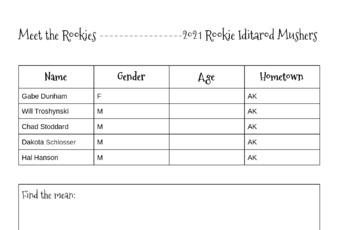
I made this mini-lesson to pre-teach mean, median, mode and range to students while their ELA class focused on a book study around the Iditarod. Students will use the Iditarod website to find the ages of the rookies who have their ages on the website. They will then find the mean, median, mode and range of those ages!**Please leave a review and check out my store for more!**
Subjects:
Grades:
4th - 7th
CCSS:

MedAware Labels and Chart Kit Booklet
Always Know When, What, Why and How Medications are taken.
(Avoid under and overdosing prescription, generic and other drugs).
Subjects:
Grades:
PreK - 12th, Higher Education, Adult Education, Staff
Social Justice in Middle School Math #3
This is the third worksheet of word problems for middle school math that highlight some of the social justice issues that are being addressed around the country. This particular worksheet is predominantly percent and proportion problems. See my two previous worksheets for other math topics. Math teachers should not and cannot stand by and let Social Studies and ELA teachers discuss social justice. Students should hear the facts from all teachers, and be educated so that each student can form his
Subjects:
Grades:
6th - 10th
Also included in: Social Justice in Math BUNDLE--NEW
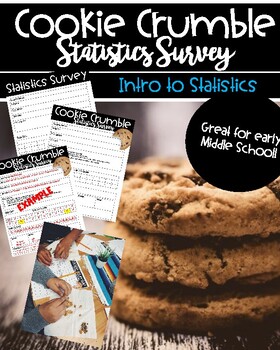
Statistics Survey-Cookie Crumble
Chocolate chip cookies aren't just a favorite after-school snack. They're also a rich source of statistical data! Kick off your Statistics Unit with some Chips Ahoy! For this activity you will need a chocolate chip cookie (any brand works) for each student or pair of students. Each student crumbles up a cookie and counts the number of whole chips. Students then collect the data from their classmates and use the data set to find the Range, Mean, Median and Mode. It is also really fun to compare y
Subjects:
Grades:
5th - 7th, Staff

Comparing Bi-Variate Data Common Core 8th Grade Scatterplot Activity
Students analyze their athletic ability and their grade point average versus how old they are relative to their classmates. Students are assigned numbers so that their is still privacy within students. Students collect and analyze data to make decisions based off of bivariate data.
Subjects:
Grades:
7th - 8th
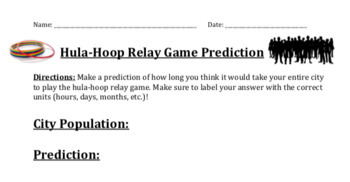
Equation of Line of Best Fit Activity (Hula-Hoop Relay Game)
This activity involves playing the hula-hoop relay game as a class to collect data. (You can find videos on youtube for demo/instructions of the game!) Students will use this data to predict how long they think it will take their town to play the game.The game:****You will need 1 hula-hoop to play this game!! (I got mine at the dollar store)****Students will start in a group of 3 and play the game, and someone will record the time it takes to play. Next, you will add another student to the group
Subjects:
Grades:
6th - 9th
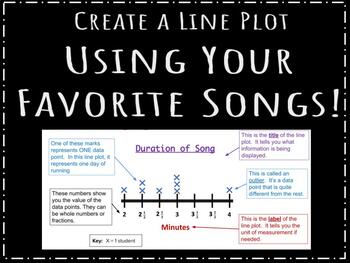
Fun Line Plot Assignment! (Minimal Prep)
Have students create a line plot using the time duration of their favorite songs! This is a great way for students to master learning the different parts of a line plot while also allowing them to "put a piece of themselves" in it! If students do not listen to music, they can use the current Top 10 most popular hits.Includes:- Slides to present to your students- Student handout for the activity
Subjects:
Grades:
5th - 7th
CCSS:
Showing 1-24 of 35 results


