18 results
High school statistics thematic unit plan activboard activities under $5
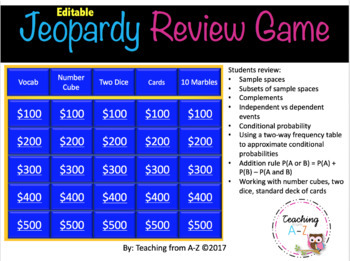
Probability Review Game
Use this Jeopardy-like review game to improve your students' understanding of key concepts in probability. This is a fun way to have students review:*Sample spaces*Subsets of sample spaces*Complements*Independent vs dependent events*Conditional probability*Using a two-way frequency table to approximate conditional probabilities*Addition rule P(A or B) = P(A) + P(B) – P(A and B)*Working with number cubes, two dice, standard deck of cardsThis is a PowerPoint Presentation. You can EDIT the problems
Subjects:
Grades:
9th - 12th
Also included in: Algebra Review Game Growing Bundle
Descriptive Statistics Unit Project - 13 Topics Covered, Print and Digital
I used this for the first time this year and I REALLY liked it. We have a very short statistics unit in Math 1 in North Carolina, and I have always hated that unit because it just feels like an afterthought at the end of the year when the kids are as burnt out as you are. But this worked WELL!! The way it works is this: the student picks two topics where they can find at least 20 pieces of data. Examples include population of states east of the Mississippi or the number of points scored in
Subjects:
Grades:
7th - 11th

Charts & Graphs - Complete Unit of Work
In this unit, students will look at how they can use charts and graphs to represent data in maths. They start by looking at using co-ordinates on graphs, including using graph scales in multiples. Then, students will look at the following graphs – pictograms, bar charts (including composite and comparative bar charts), vertical line graphs, line graphs, histograms with equal class intervals and stem and leaf diagrams. Finally, students will look at how to choose the appropriate graph to display
Subjects:
Grades:
6th - 9th
Also included in: Complete Bundle - All units of work
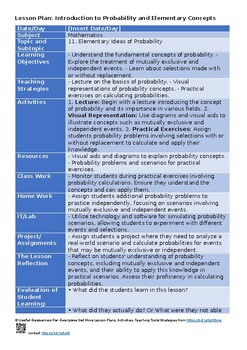
11. Elementary ideas of probability -O Level Statistics 4040 Lesson Plans Unit P
Dive into Probability with Our Comprehensive Lesson Plans! Title: Elementary Ideas of Probability - O Level Statistics 4040 Lesson Plans Unit Plans Thematic Lesson Plans Uncover the world of probability with our meticulously crafted lesson plans. "Elementary Ideas of Probability - O Level Statistics 4040 Lesson Plans Unit Plans Thematic Lesson Plans" offers an engaging exploration of this mathematical concept, equipping students with a strong foundation. Key Features:✨ Syllabus Aligned: Our le
Subjects:
Grades:
5th - 12th, Adult Education, Staff

Sampling Distribution Activity for AP Statistics (or lower) -German Tank Problem
This is a fun way for your statistics class to kick-off a unit on sampling distributions (and ultimately the Central Limit Theorem). It also connects math to history. During World War 2, the Germans put serial numbers on all their tanks. These serial numbers were in numerical order. When the allies found these tanks, their statisticians were able to predict how many tanks the Germans were producing. Your students will recreate this activity and so be set up for a discussion of sampling distr
Subjects:
Grades:
9th - 12th, Higher Education
CCSS:
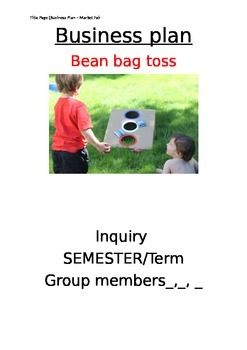
Market Fair Activity Plan - Inquiry Process
Planning a fair or market at your school?
Do you want your students to be involved and run stalls?
Here is a business plan for more senior students to use that includes the process and reflection pages.
It also includes a journal page that must be kept and a plan for the students to follow each week.
There is also examples of advertisements they can use to bring people to their stall or activity.
There is also a plan for the teacher to use. This includes the learning goals and other key pieces o
Subjects:
Grades:
5th - 10th
Probability Math Escape Room
This Math Escape Room themed on Probability covers key concepts relating to this topic such as Outcome, Impossible, Evens, Fractions, percentages and more! Escape Room is suitable for High School Math or Science students (Physics, Chemistry, Biology or Earth Sciences).Product contents:☞ Escape Room Interactive Tracker PowerPoint - Keeps the competitive nature on display☞ Escape Room Puzzle Keys (Six Sets for Six Teams)☞ Escape Room Team sheet - Record codes, answers clues as they progress throug
Subjects:
Grades:
7th - 11th
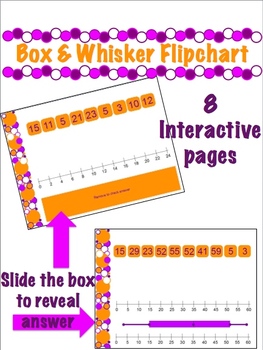
Box and Whisker Plot Flipchart for Promethean Board
This is a no frills Flipchart file for a Promethean Board. You need ActivInspire software to open and use it. It is 8 pages:Each page has a set of slidable data, a number line, and the answer behind a slidable box.It does NOT explain how to create a plot. It is practice for after your lesson.This addresses Common Core Standards: 6.SP.4 ans High School S-ID.1
Subjects:
Grades:
6th - 9th
Types:
CCSS:

Data Analysis Practice (Mean, Median, Mode, Outliers, Graphing)
Worksheet practicing skills such as:
- Calculating Mean, Median, Mode, Range, Outliers
- Choosing the best graph/measure of central tendency
- Drawing & Analyzing Circe Grapgs
Subjects:
Grades:
5th - 9th

MEAN, MEDIAN, MODE AND RANGE, INTER-QUARTILE RANGE
This lesson focuses on different types of averages, the location and spread of data, and the pro's and con's of each. The power point uses a case study to help explain how mean, median, mode, range and inter-quartiles are calculated, and what each type of statistic shows. This lesson is designed to be interactive, with questions/ answers included. This also reduces the need for printing. Although originally designed for GCSE, this resource will prove useful in any math lesson. Learning aims are
Subjects:
Grades:
8th - 11th
CUMULATIVE FREQUENCY, BOX PLOTS (BOX & WHISKER DIAGRAMS) & INTERQUARTILE RANGE
This lesson looks at plotting cumulative frequency curves from tables and using box plots (box and whisker diagrams) to analyse the data from these. Interquartile range is also included/ explored. This lesson aims to show learners how to draw and understand cumulative curves in a step-by-step way that is both visual and interactive, with questions and answers included. This also reduces the need for printing and makes good, printable revision notes. This resource will prove useful in any maths l
Subjects:
Grades:
7th - 12th

Skeleton Notes: Counting Principles and Basic Probability
This file is a unit of skeleton notes for counting principles and basic probability. They are meant to be used by the teacher as an instructional aid.Skills included areTree diagramsMultiplication rulePermutationsCombinationsTheoretical probabilityExperimental probabilityAddition RuleConditional Probability
Subjects:
Grades:
8th - 12th
CCSS:
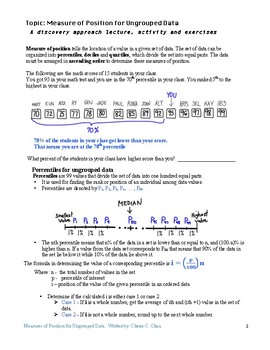
Measures of Position for Ungrouped Data - A Discovery Approach
Having difficulty in teaching Measures of Position for Ungrouped data?
Does your student still confuse which formula to take? or maybe they knew how to solve it but they don't understand what they are solving!
Grab this Lecture- Activity - Exercises all in one all about Measures of Position for Ungrouped data!
This includes, all the important points and terms in Measures of Position, Easy to understand and student's learn it by discovering the meaning and concept on this simple activity.
This
Subjects:
Grades:
8th - 11th, Higher Education, Adult Education

Presidential Election Night Results
Assign your students to watch as much of the election night coverage as they can before going to bed. They can complete this tallying chart which includes all 50 states to keep track of the number of states won by each candidate. The number of electoral votes per state is also included. The next morning at school, you can give them the rest and they can put their calculators to use by totally up the electoral votes for each candidate. It will make a great eye opener for the morning after the
Subjects:
Grades:
4th - 12th, Higher Education, Adult Education
SCATTER GRAPHS, LINE GRAPHS AND STEM & LEAF DIAGRAMS
This lesson focuses on interpreting scatter diagrams and appreciating the relationship that a large amount of data can show. It also looks at plotting stem and leaf diagrams and calculating averages from these, as well as plotting and interpreting line graphs. This lesson is designed to be fairly interactive, with questions/ answers included. This also reduces the need for printing. Although originally designed for a GCSE group, this resource will prove useful in any math lesson. Learning aims a
Subjects:
Grades:
8th - 11th
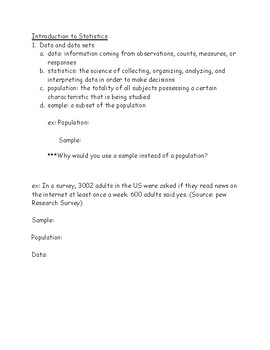
Skeleton Notes: Introduction to statistics
This file is a unit of skeleton notes for an introduction to statistics. They are meant to be used by the teacher as an instructional aid.Skills included arePopulationSampleParameterStatisticBranches of statisticsTypes of dataLevels of dataMethods of data collectionSampling techniques
Subjects:
Grades:
9th - 12th

Chapter 13: Statistics & Probability - Activinspire Flipcharts
Pre-Algebra Chapter 13 notes on a flipchart file to be used with a Promethean, Smartboard or other Interactive boards. This is a completely EDITABLE collection of the lessons that I teach throughout the school year. Lessons compatible with McGraw-Hill Glencoe Pre-Algebra textbook and Common Core Standards.You can earn FREE TPT money by leaving reviews on any paid resources! You will see the balance show up the next time you check out!Also, be sure to check out my teaching videos at this link: ht
Subjects:
Grades:
5th - 12th
Also included in: Pre-Algebra lesson notes for the "ENTIRE YEAR" - Activinspire Flipcharts
Measures of Central Tendency
Powerpoint presentation going over mean, median, mode and range, as well as a practice slide great for whiteboard practice in class.
Subjects:
Grades:
9th
Showing 1-18 of 18 results


