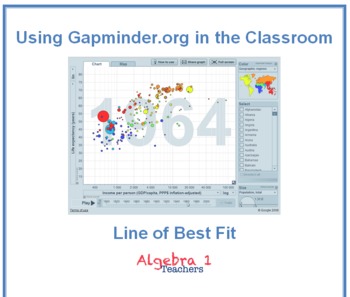
Gapminder: Line of Best Fit
Algebra1Teachers
151 Followers
Algebra1Teachers
151 Followers
Compatible with Digital Devices
The Teacher-Author has indicated that this resource can be used for device-based learning.
Description
Gapminder.com is a very powerful data analysis tool that uses the most current data to allow everyone to look at trends within our world. It is a great learning tool, but if your students are anything like mine, they need direction and structure. I created this lesson to help my students understand this powerful tool at the basic level so that we can use it to investigate statistics in my Algebra 1 class. This will also help cover S.Q.2 from the Common Core for Algebra 1.
Please check back soon for lessons on box and whisker, measures of central tendencies, correlation vs. causation, correlation coefficient, standard deviation, and outliers.
You will need computers for every student for this activity to run effectively. You may also want to print a reference sheet for each student from www.gapminder.org/world depending on how well your students understand technology.
Students will:
• Understand the graphical representations within Gapminder.org
• Create a table from the data
• Understand Correlation Trends
• Write an equation for the Line of Best Fit
• Understand the Relationship between Tables, Graphs, and Equations from Data.
• Predict Future Events about Data
• Make Inferences about Historical Data
I hope you find this resource as useful as I have. If you use the Gapminder: Line of Best Fit activity, please leave feedback. I would love to hear from you. Thank you.
Jeanette Stein
Total Pages
12 pages
Answer Key
Not Included
Teaching Duration
N/A
Last updated Oct 29th, 2012
Report this resource to TPT
Reported resources will be reviewed by our team. Report this resource to let us know if this resource violates TPT’s content guidelines.
Standards
to see state-specific standards (only available in the US).
CCSSHSS-ID.A.2
Use statistics appropriate to the shape of the data distribution to compare center (median, mean) and spread (interquartile range, standard deviation) of two or more different data sets.


