243 results
Statistics lessons for Google Apps
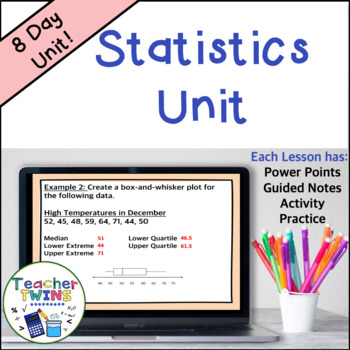
Statistics Unit - Mean Absolute Deviation - Populations and Samples - Box Plots
Make lesson planning easy with this no-prep Statistics - Mean Absolute Deviation - Populations and Samples - Box-and-Whisker Plots Unit! Included are 8 ready-made lessons to teach finding mean absolute deviation as well as interpreting and creating box-and-whisker plots. This unit is very easy to use and will save you a lot of time! Your students will learn how to find mean absolute deviation and interpret box-and-whisker plots by using our editable PowerPoints with guided notes. Students will l
Subjects:
Grades:
6th - 8th
Also included in: 7th Grade Math Curriculum Bundle
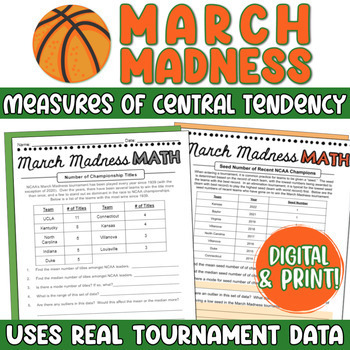
March Madness Math Mean, Median, Mode - Measures of Central Tendency Activity
This March Madness math activity asks students to determine mean, median, mode, and range for a variety of actual statistics from previous NCAA March Madness basketball tournaments. Perfect to excite any sports enthusiasts! It includes both print and digital formats, perfect for Google Classroom.Each page slide within the activity is dedicated to a different statistic (for example, years since previous championships amongst winners, regular season wins amongst Elite 8 teams, Seeds of Champions
Subjects:
Grades:
6th - 8th
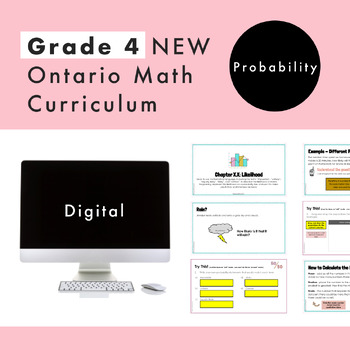
Grade 4 Ontario Math - Probability - Digital Google Slides + Form
Are you planning for the NEW Grade 4 Ontario Math Curriculum? This editable Google Slide and Google Form resource is what you need! This resource is for the DATA strand and and covers specific expectations for “D2. Probability”. In this resource, students will experience math through engaging real-life questions, storytelling through math, and interactive slides. What’s Included2 Google Slide presentations45 UNIQUE and EDITABLE Google Slides in totalSlides are editable for you to increase stud
Subjects:
Grades:
3rd - 5th
Types:
Also included in: Grade 4 NEW Ontario Math Curriculum Full Year Digital Slides Bundle
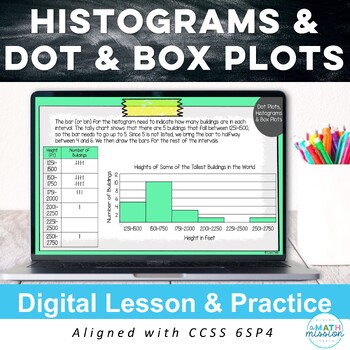
Statistics Histograms Box Plots Dot Plots Digital Math Lesson 6SP4 Activity
Save yourself time with this editable, digital math resource! Included is the lesson and practice for displaying numerical data on histograms, box and whisker plots, and dot plots. This digital activity guides students through the 6.SP.4 standard. Informational lesson pages are intertwined with interactive learning activity slides. Students drag or type in answers on the Google Slides. Great alternative to worksheets! These can be used in so many ways: math centers, stations, extra practice, as
Subjects:
Grades:
6th - 7th
CCSS:
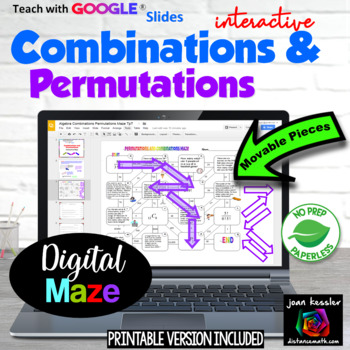
Permutations and Combinations Digital Maze + HW and Printable version
This Combinations, Permutations, and Counting Fun Maze is NO PREP for you and engaging,challenging, and fun for your students. This resource included both a digital and printable version. This activity reinforces the concepts of permutations, combinations, and counting principles and is great practice. The different types of problems are placed randomly in the maze so that students must first decide the type of question before solving. The questions on the maze are letter coded so that if a s
Subjects:
Grades:
8th - 11th
Types:
CCSS:
Also included in: Algebra 2 Digital MEGA Bundle plus Printables
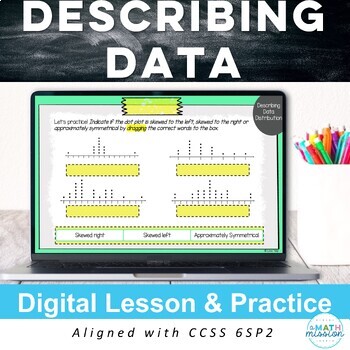
Statistics Describing Data Distribution Digital Lesson & Practice 6SP2 Activity
Save yourself time with this editable, digital math resource! Included is the lesson and practice for describing distribution of data using dot plots and histogram to identify gaps, peaks, range, outliers, skewed left & skewed right, and how to read a box plot. This digital activity guides students through the 6.SP.2 standard. Informational lesson pages are intertwined with interactive learning activity slides. Students drag or type in answers on the Google Slides. Great alternative to works
Subjects:
Grades:
6th - 7th
CCSS:
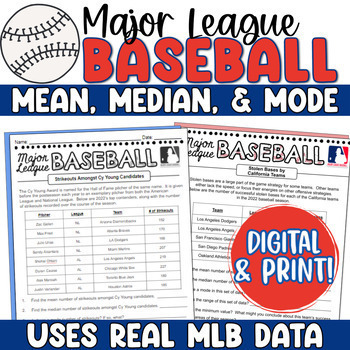
Baseball Math Mean, Median, Mode - MLB Baseball Measures of Central Tendency
This real-world baseball math statistics project asks students to determine mean, median, mode, and range for a variety of actual statistics from the 2023 Major League Baseball season. Perfect to excite any sports enthusiasts! It includes both a traditional print option and a digital version, made for Google for any 1:1 classrooms!Each slide within the activity is dedicated to a different statistic (for example, strikeouts amongst Cy Young candidates, or homeruns amongst MVP candidates). Stud
Subjects:
Grades:
6th - 9th
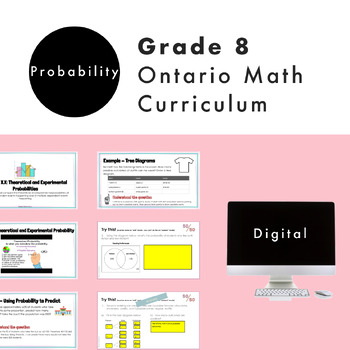
Grade 8 Ontario Math Probability Digital Google Slides + Form
Do you need a practical and engaging resource for the NEW Ontario Math Number strand? Are you planning for the NEW Grade 8 Ontario Math Curriculum? This editable Google Slide resource is what you need! This resource is for the Grade 8 DATA strand and covers specific expectations for “D2 Probability". In this resource, students will experience math through engaging real-life questions, storytelling through math, and interactive slides. What’s Included2 Google Slide presentations67 UNIQUE and ED
Subjects:
Grades:
7th - 9th
Types:
Also included in: Grade 8 NEW Ontario Math Curriculum Full Year Digital Slides Bundle
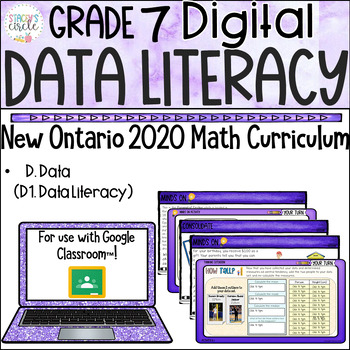
Grade 7 Data Literacy NEW Ontario Math Digital Google Slides : D . Data
This comprehensive digital Ontario Math resource covers EVERY single specific expectation from the D1. Data Literacy strand in the NEW Grade 7 2020 Ontario Math Curriculum-- See below for specific expectations. Grade 7 Teachers, you're going to want this in your collection! WHY BUY THIS PRODUCT OVER OTHERS?My vision for teaching math is always "Don't just tell the story, let the students experience the story first hand". HOW?Students will be walked through curriculum concepts step-by-step in eas
Subjects:
Grades:
6th - 8th
Types:
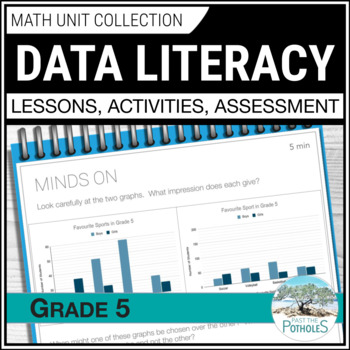
Data Management Unit: Reading Graphs Collecting & Analyzing Data Infographics
Save time and reduce stress!! This UPDATED Data Literacy unit has EVERYTHING YOU NEED. Students will learn about reading graphs, collecting data, analyzing data, misleading graphs, averages, and more. It includes 3-part Google Slides lessons, worksheets, games, centres, assessments, and report card comments.LOCK IN THIS PRICE! **You will have FREE LIFETIME UPDATES for any future updates and additions.**Lesson topics: ❉ Collecting Data using Sampling techniques ❉ Organizing Data using frequenc
Subjects:
Grades:
5th - 6th
Types:
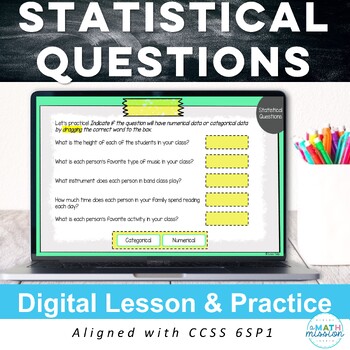
Statistical Questions Digital Math Lesson and Practice 6SP1 Activity 6th grade
Save yourself time with this editable, digital math resource! Included is the lesson and practice for statistical questions, and categorical & numerical data. This digital activity guides students through the 6.SP.1 standard. Informational lesson pages are intertwined with interactive learning activity slides. Students drag or type in answers on the Google Slides. Great alternative to worksheets! These can be used in so many ways: math centers, stations, extra practice, as a teacher guided l
Subjects:
Grades:
6th - 7th
CCSS:
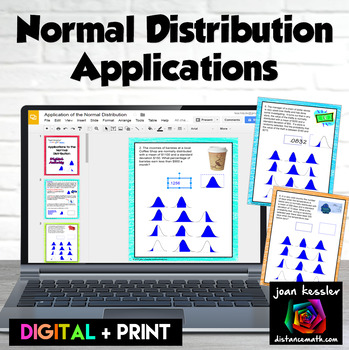
Normal Distribution Applications Digital Activity plus Print
In this digital interactive activity for Applications of the Normal Distribution your students will solve 10 real world applications of the Normal Distribution with GOOGLE® Slides. They will first analyze the problem, then “sketch” the scenario by selecting one of 12 shaded normal distribution diagrams, and then determine the solution either using technology or manually by tables using z-scores.A printable version of the questions is also included. Students will also read, analyze and sketch
Subjects:
Grades:
9th - 12th
Types:
CCSS:
Also included in: Probability and Statistics Algebra 2 Unit 11 Activity Bundle
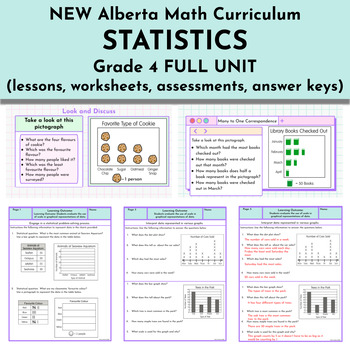
Statistics Unit - NEW Alberta Math Curriculum Grade 4
This Grade 4 Statistics resource is intended to meet the NEW 2023 Alberta Math curriculum expectations. Learning Outcome: Students evaluate the use of scale in graphical representations of data.Skills and Procedures:Engage in a statistical problem-solving process.Select an appropriate scale to represent data.Represent data in a graph using many-to-one correspondence.Describe the effect of scale on representation.Justify the choice of graph used to represent certain data.Compare different graphs
Subjects:
Grades:
4th
Types:
Also included in: FULL YEAR Alberta Math Curriculum - Grade 4
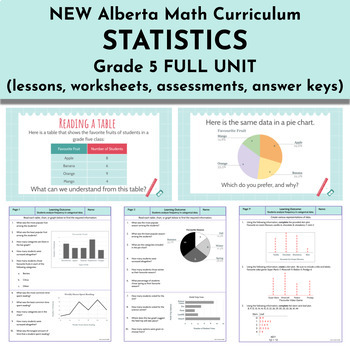
Statistics Unit - NEW Alberta Math Curriculum Grade 5
This Grade 5 Statistics resource is intended to meet the NEW 2023 Alberta Math curriculum expectations. Learning Outcome: Students analyze frequency in categorical data.Skills and Procedures:Examine categorized data in tables and graphs.Determine frequency for each category of a set of data by counting individual data points.Identify the mode in various representations of data.Recognize data sets with no mode, one mode, or multiple modes.Justify possible answers to a statistical question using m
Subjects:
Grades:
5th
Types:
Also included in: FULL YEAR Alberta Math Curriculum - Grade 5
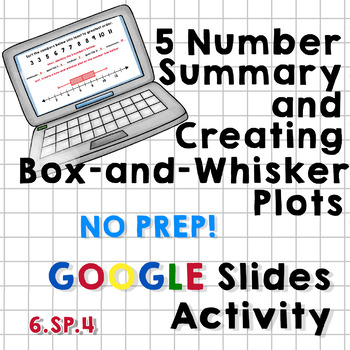
5-Number Summary and Box Plots Google Slides Activity - NO PREP - 6.SP.4
This Google Slides Activity includes 6 slides with different sets of numbers that students are asked to sort, identify the minimum and maximum, quartiles 1 and 3, and the median. When done with this process, students are asked to use the shapes provided to create a box-and-whisker plot to represent the 5-number summary.The slides are very easy to duplicate and a 7th slide with additional numbers is provided in the event that a teacher would like to duplicate slides and add additional sets of nu
Subjects:
Grades:
6th - 7th
Types:
CCSS:
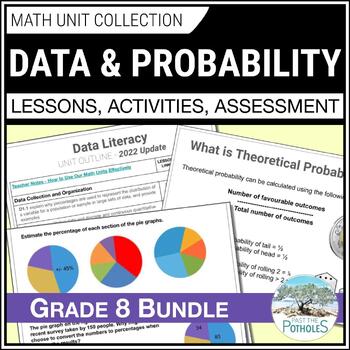
Ontario Math Unit Bundle: Data Management Theoretical & Experimental Probability
This UPDATED math bundle covers the DATA MANAGEMENT & PROBABILITY units of the Grade 8 Ontario math curriculum. It includes EVERYTHING YOU NEED to guide students with reading graphs, collecting data, theoretical & experimental probability, infographics, and more. It contains Google Slides lessons, worksheets, stations, assessments, and report card comments. This unit is MORE THAN JUST WORKSHEETS! Activities encourage students to use and develop their Knowledge, Application, Thinking, and
Subjects:
Grades:
7th - 9th
Types:
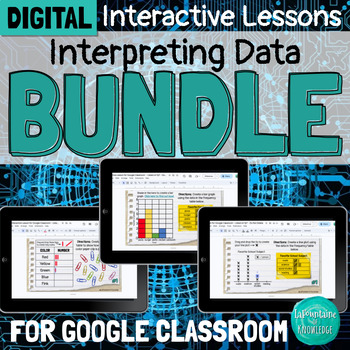
DIGITAL Interpreting Data Interactive Lesson Bundle for Google Classroom
This bundle of 3 digital interactive math lessons for Google Classroom teaches interpreting categorical and numerical data using frequency tables, bar graphs, and line plots. Each lesson includes: a video lesson (YouTube and Loom viewing options included) practice problems and activitiesteacher directions and answer keysThese lessons are ready to assign and easy for students to complete independently. Students will learn:important vocabulary - title, categories, tally marks, key, categorical dat
Subjects:
Grades:
3rd - 5th
Types:
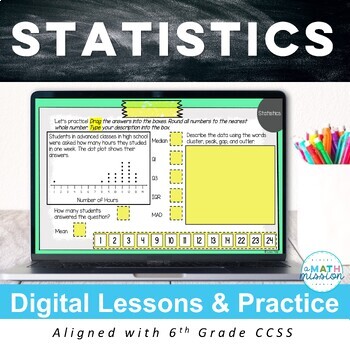
Statistics Unit Digital Lessons & Practice Activities for use with Google™
Engage your students and save yourself time with these distance learning lessons. These digital activities guide students through all the 6th grade common core statistics & probability standards. Informational lesson pages are intertwined with interactive learning activity slides. Students drag and drop or type in answers on the Google Slides. Great alternative to worksheets! These can be used in so many ways: math centers, stations, extra practice, as a teacher guided lesson or for students
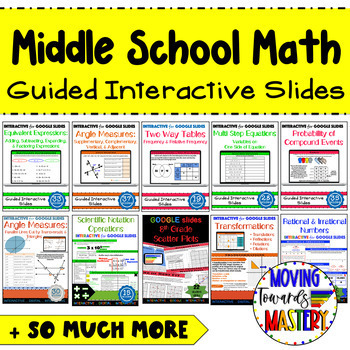
Middle School Math Digital Guided Interactive Lessons
Digital resources with differentiation - The guided interactive math lessons are aligned to Common Core Standards.The slides are scaffolded to build understanding and provide differentiation. The guided slides will begin with information, move towards assisted practice, and conclude with independent practice.Google Slides included...♦ Adding & Subtracting Integers/Rational Numbers♦ Multiplying & Dividing Integers/Rational Numbers♦ Rational & Irrational Numbers♦ Exponent Rules♦ Square
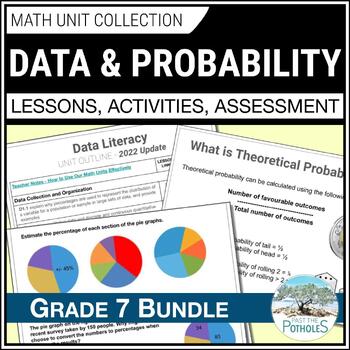
Ontario Math Unit Bundle: Data Management Theoretical & Experimental Probability
This UPDATED math bundle covers the DATA MANAGEMENT & PROBABILITY unitsof the Grade 7 Ontario math curriculum. It includes EVERYTHING YOU NEED to guide students with reading graphs, collecting data, theoretical & experimental probability, infographics, and more. It contains Google Slides lessons, worksheets, stations, assessments, and report card comments.Our units encourage students to use and develop their Knowledge, Application, Thinking, and Communication skills in a way that will pr
Subjects:
Grades:
6th - 8th
Types:
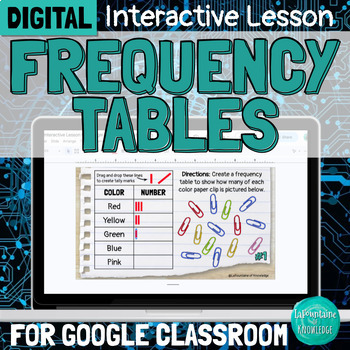
DIGITAL Frequency Tables Interpreting Data Interactive Lesson
This interactive Google Slides lesson introduces students to frequency tables and demonstrates how to interpret both categorical and numerical data. The lesson covers:the parts of a frequency table (title, categories, and tally marks)the difference between categorical and numerical datahow to interpret data (answer questions) using a frequency tablehow to create a frequency table This resource includes:a 9 minute video lesson (YouTube and Loom viewing options provided) 14 practice problems - stu
Subjects:
Grades:
3rd - 5th
Types:
Also included in: DIGITAL Interpreting Data Interactive Lesson Bundle for Google Classroom
Distance Learning | Statistics: Mean, Median, Mode, Range Digital Lesson
This Digital Google Slides Mean, Median, Mode, and Range lesson is a full 3-part lesson. This product includes notes, student practice, and an exit ticket. This is aligned to 6th grade Common Core Standards and hits on ONE part of 6.SP.B.5C, finding the mean and median of data sets to analyze quantitive measures of center. Mode and Range are added spiral review in this lesson as they relate closely with mean and median.About This Product:-1 cover/title slide-1 notes slide with examples, vocabul
Subjects:
Grades:
6th
Types:
CCSS:
Also included in: 6th Grade Math Statistics Bundle | CCSS Aligned
Mean, Median, Mode & Range Lesson | Printable & Digital
About this Product• This download includes resources needed for one 45-minute science lesson. No prep needed!• The resources in this download are re-bundled from my Lab Practices Mini Unit Bundle.• Purchase materials for the topic(s) pertinent to your classroom - not an entire unit!• Files in this download are optimized for use with Adobe and Microsoft Office Products.Important Notes• Download a FREE Lesson to learn more about the resources included HERE.• Save 50% with the Nature of Science Bu
Subjects:
Grades:
6th - 10th
Types:
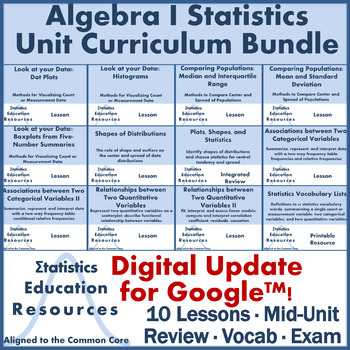
Bundle: Algebra 1 Statistics Unit Curriculum (Common Core)
UPDATE: Now includes lesson slides and editable worksheets for Google™ Slides and unit exam in Google™ Forms!Algebra I Statistics Unit BundleThis product is a bundle that includes 10 Common Core Aligned lessons, 4 statistics vocabulary lists (1 master list for the whole unit, and 3 smaller unit “sub lists”), 1 mid-unit integrated mini-review and worksheet (as homework or a quiz!), and 1 exam with answer key. Each lesson includes lecture slides with speaker notes, a handout, worksheet with answer
Subjects:
Grades:
8th - 11th
Types:
CCSS:
Showing 1-24 of 243 results


