
March Madness Math Mean, Median, Mode - Measures of Central Tendency Activity


- Google Drive™ folder

What educators are saying
Also included in
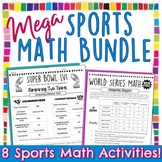 Do you need engaging activities for the sports fans in your math classroom? This sports math bundle will have your students excited to practice their skils! It uses current real-world stats to explore popular events, such as Super Bowl, March Madness, and the World Series. Additional resources inPrice $25.00Original Price $33.25Save $8.25
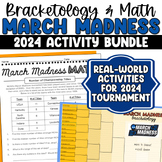 Do you and your students love March Madness? This 2024 bracketology and math activity is perfect for the sports enthusiasts in your classroom!It includes a fully-interactive bracket made for Google Sheets. Once you upload the bracket to Google Classroom, students complete their bracket, compute tPrice $6.75Original Price $9.00Save $2.25
Description
This March Madness math activity asks students to determine mean, median, mode, and range for a variety of actual statistics from previous NCAA March Madness basketball tournaments. Perfect to excite any sports enthusiasts! It includes both print and digital formats, perfect for Google Classroom.
Each page slide within the activity is dedicated to a different statistic (for example, years since previous championships amongst winners, regular season wins amongst Elite 8 teams, Seeds of Championship teams...). Students use data to determine the measures of central tendency. Each category also has a higher-order thinking extension question.
An answer key is included, and the digital Google Slides version is equipped with text-boxes ready to go. Truly no-prep!
*This resource has been updated to reflect statistics from the most recent 2023 tournament. It will continue to be updated each year, so that students may work with the data from last year's tournament as they are getting excited about March Madness! You may redownload each year's update at no extra cost to you!
Would your students like to fill out their own March Madness bracket and compete with their classmates?
March Madness Bracketology: Digital Activity for Google
Like what you see? Follow me for more sports math resources and freebies!
