969 results
3rd grade statistics resources for Google Apps and for homeschool
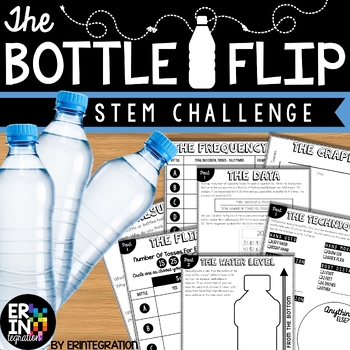
Water Bottle Flip STEM Challenge + STEM Activity
The ORIGINAL water bottle flip STEM activity and lab! Water bottle flip at school? Absolutely! Students will love this on-trend STEM challenge inspired by the popular YouTube water bottle flipping challenge where students toss a water bottle and attempt to land it straight up. Practice scientific method with some probability, fractions and data collection in the mix while having fun!This self-paced, low-prep, project based learning water bottle flip STEM challenge is print-and-go. Each activit
Subjects:
Grades:
3rd - 6th
Types:
CCSS:
NGSS:
K-2-ETS1-2
, K-2-ETS1-3
, MS-ETS1-2
, K-2-ETS1-1
, 3-5-ETS1-3
...
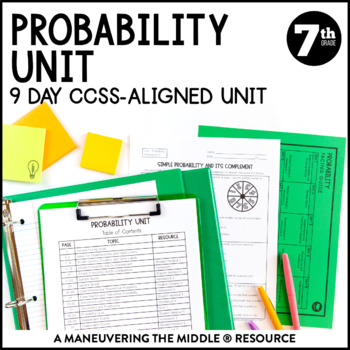
Probability Unit | Independent and Dependent Events | 7th Grade Math Notes
A 9 day CCSS-Aligned Probability Unit - including simple probability, experimental and theoretical probability, making predictions, and independent and dependent probability.Students will practice with both skill-based problems, real-world application questions, and error analysis to support higher level thinking skills. You can reach your students and teach the standards without all of the prep and stress of creating materials!Standards: 7.SP.5, 7.SP.6, 7.SP.7, 7.SP.8; Texas Teacher? Grab the T
Subjects:
Grades:
7th
Types:
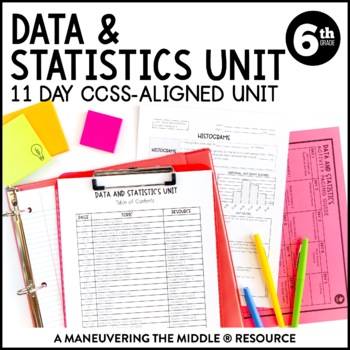
Data & Statistics Unit | Measures of Center, Dot and Box Plots, & Histograms
An 11 day CCSS-Aligned Statistics Unit - including statistical questions, describing data, and analyzing data with dot plots, box plots, and histograms. Students will understand measures of center and variability and how they relate to displays of data. Students will practice with both skill-based problems, real-world application questions, and error analysis to support higher level thinking skills. You can reach your students and teach the standards without all of the prep and stress of creatin
Subjects:
Grades:
6th
Types:
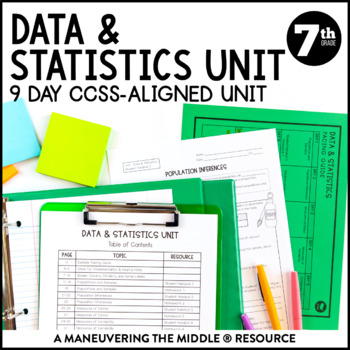
Data and Statistics Unit | Random Sampling, Dot Plot, & Box Plot 7th Grade Notes
A 9 day CCSS-Aligned Statistics Unit - including populations and samples, drawing inferences from samples, measures of centers and variability, comparing and analyzing dot and box plots. Students will practice with both skill-based problems, real-world application questions, and error analysis to support higher level thinking skills. You can reach your students and teach the standards without all of the prep and stress of creating materials!Standards: 7.SP.1, 7.SP.2, 7.SP.3, 7.SP.4; Texas Teache
Subjects:
Grades:
7th
Types:
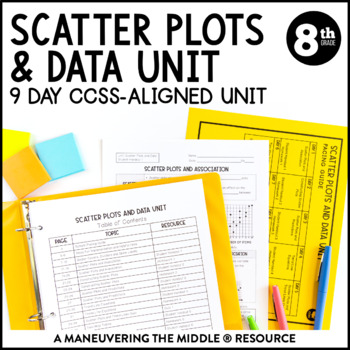
Scatter Plots and Data Unit | 8th Grade Math | Line of Best Fit Notes
A 9 day CCSS-Aligned Scatter Plots and Data Unit - including scatter plots, trend lines, two-way tables and relative frequency.Students will practice with both skill-based problems, real-world application questions, and error analysis to support higher level thinking skills. You can reach your students and teach the standards without all of the prep and stress of creating materials!Standards: 8.SP.1, 8.SP.2, 8.SP.3, 8.SP.4; Texas Teacher? Grab the TEKS-Aligned Scatter Plots and Data Unit. Please
Subjects:
Grades:
8th
Types:
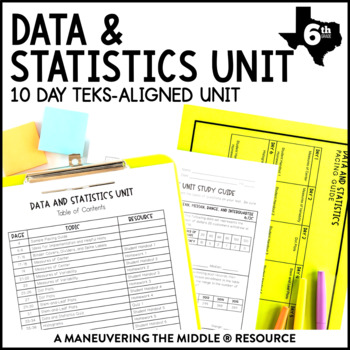
Data and Statistics TEKS Unit | Stem & Leaf Plots, Histograms, Frequency Tables
A 10 day Data and Statistics TEKS-Aligned complete unit including: measures of center, measures of variability, dot plots, stem-and-leaf plots, histograms, and categorical data.Students will practice with both skill-based problems, real-world application questions, and error analysis to support higher level thinking skills. You can reach your students and teach the standards without all of the prep and stress of creating materials!Standards: TEKS: 6.12A, 6.12B, 6.12C, 6.12D, 6.13A, 6.13B; Lookin
Subjects:
Grades:
6th
Types:
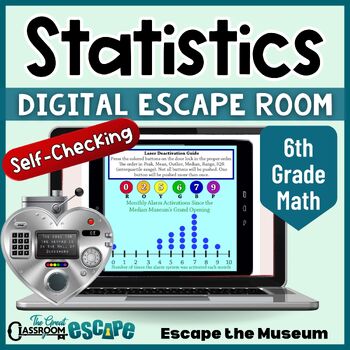
6th Grade Math Data Analysis & Statistics Activity Digital Escape Room Game
Find the median, read the box plot, interpret the frequency table, and unlock the door! This 6th grade math activity based on statistics and probability standards will put your students statistical skills to the test. Your students are volunteer docents at the Median Museum. After the security system locks everyone in, they will need to use their knowledge of statistics to escape the museum. This engaging digital escape room is easy for teachers to implement. The breakout process is fully autom
Subjects:
Grades:
6th - 7th
Types:
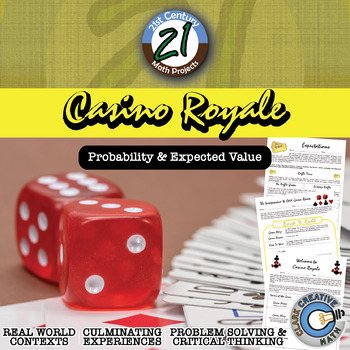
Casino Royale -- Expected Value & Probability Game - 21st Century Math Project
Your students might be begging for for a day for them to play games. Let it be on your terms in this 21st Century Math Project! This Expected Value and Probability Project focuses on one of the more emphasized aspects of the Common Core Standards. Students will be asked to design their own games with defined expected value and host it in a Game Day event! The student that collects the most "Swagg Cash" will forever (or at least for 36 hours) be known as the Master of Swagg. ***THIS PRODUCT HAS B
Subjects:
Grades:
6th - 12th
Types:
CCSS:
Also included in: Probability & Expected Value Unit Bundle - Distance Learning Compatible
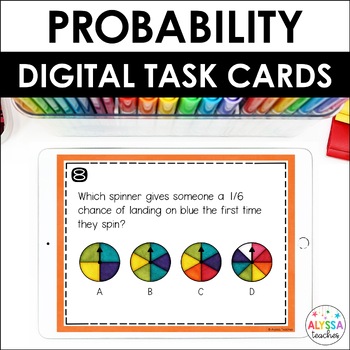
Probability Task Cards (Digital)
Probability is one of my favorite math topics to teach! These digital probability task cards make a great review activity for math centers, warmups, early finishers, and more. You can use this set during your probability unit or save it for an end-of-year test review.To complete the task cards, students move objects on the screen and type answers to questions. They'll complete everything directly in Google Slides. No prep for you; no lost papers for them!Students will:use probability vocabulary
Subjects:
Grades:
4th - 5th
Types:
CCSS:
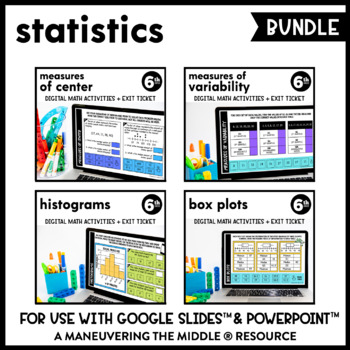
Statistics Digital Math Activity Bundle | Measures of Center | Google Slides
These supplemental digital math activities can be used to support data and statistics concepts. They are interactive (drag and match, using the typing tool, using the shape tool) and paperless through Google Slides™ and PowerPoint™. Topics Included:Measures of Center (4 interactive slides + exit ticket)Measures of Variability (4 interactive slides + exit ticket)Histograms (4 interactive slides + exit ticket)Box Plots (4 interactive slides + exit ticket)What is included?1. Paperless Math Activit
Subjects:
Grades:
6th
Types:
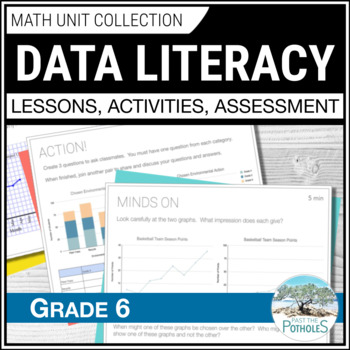
Data Management Unit: Reading Graphs Collecting & Analyzing Data Grade 6 Ontario
Save time and reduce stress!! This UPDATED Grade 6 Ontario Math Data Literacy unit has EVERYTHING YOU NEED. Students will learn about reading graphs, collecting data, analyzing data, misleading graphs, averages, and more. It includes 3-part Google Slides lessons, worksheets, games, centres, assessments, and report card comments. New histograms, broken-line graphs and infographic content are included with data analysis and data collection! SPECIFIC LESSON TOPICS:✓ Discrete and Continuous Data✓
Subjects:
Grades:
5th - 7th
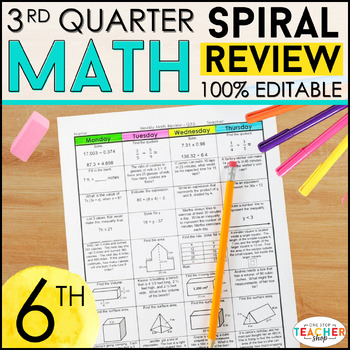
6th Grade Math Review& Quizzes | 6th Grade Math Homework | 3rd QUARTER
This 6th Grade math spiral review resource can easily be used as math HOMEWORK, WARM UPS, or a DAILY MATH REVIEW! This resource was designed to keep math concepts fresh all year and to help you easily track student progress. All pages are 100% EDITABLE and easy to differentiate to fit your students' needs. Get the ENTIRE YEAR BUNDLE! {CLICK HERE}☝☝ Check out the Preview for more details and 3 FREE Weeks! ☝☝This Spiral Review System is also available forLANGUAGE (Grammar & Word Study)READINGG
Subjects:
Grades:
6th
Types:
Correlation All-Star -- Sports Data Analysis - 21st Century Math Project
Bring an authentic sports-based math project to your Algebra, Algebra 2 or PreCalculus classroom with Lines of Best Fit and Correlations! All in this 21st Century Math Project! Using data from the MLB, NBA, NFL and NHL students investigate correlations to some of sports most common questions like: "Do more shots result in more goals?" "Do hitters or pitchers have more impact on a team's wins?""What NFL stat is most strongly correlated with wins?" and the grand-daddy..."Can money buy championship
Subjects:
Grades:
7th - 12th
Types:
CCSS:
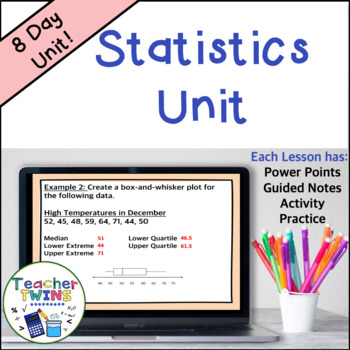
Statistics Unit - Mean Absolute Deviation - Populations and Samples - Box Plots
Make lesson planning easy with this no-prep Statistics - Mean Absolute Deviation - Populations and Samples - Box-and-Whisker Plots Unit! Included are 8 ready-made lessons to teach finding mean absolute deviation as well as interpreting and creating box-and-whisker plots. This unit is very easy to use and will save you a lot of time! Your students will learn how to find mean absolute deviation and interpret box-and-whisker plots by using our editable PowerPoints with guided notes. Students will l
Subjects:
Grades:
6th - 8th
Also included in: 7th Grade Math Curriculum Bundle
Medical Trial -- Statistics & T-Test - 21st Century Math Project
Bring your students into the world of double blind medical studies. Every day, doctors and hospitals rely on scientific studies and research to make healthcare decisions for patients. Are some medicines more effective than others? Do certain types of patients benefit more from certain types of treatments? Due to the security of medical records, studies are somewhat limited in their scope and are generally carried out at universities and research hospitals. At these facilities ground breaking wo
Subjects:
Grades:
8th - 12th
Types:
CCSS:
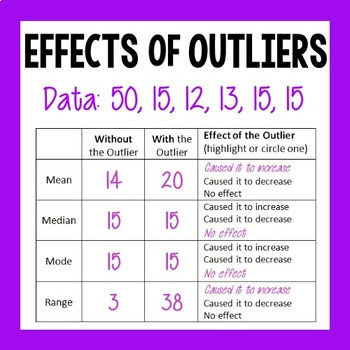
Effects of Outliers - NOW WITH DISTANCE LEARNING GOOGLE SLIDES!
How does an outlier affect the mean, median, mode, or range? Does it always have an effect? What predictions can you make about how the outlier will affect these measures?These 6 quick and easy tables will help you students make generalizations (such as a larger outlier will always increase the mean). And now this product also includes a Google Slides version, compatible with Google Classroom for Distance Learning! You will receive a 2-page student PDF version, and an answer key. And you wil
Subjects:
Grades:
5th - 6th
Types:
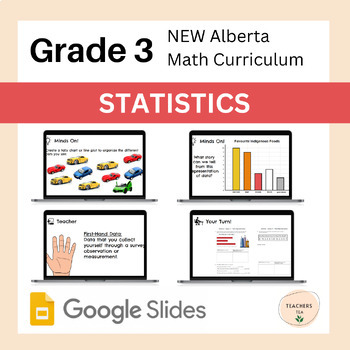
Alberta Grade 3 Math- Statistics- Google Slides COMPLETE UNIT
This is a COMPLETE UNIT to deliver the New Grade 3 Alberta Math Patterns and Sequences Unit.This is a ready-to-teach, ready-to-print unit that you can use in any elementary classroom. It is fully editable and can be adjusted for other standards and outcomes and grade levels.This Unit Includes the Google Slides Patterns and Sequences Unit, Student Sheets and Unit Exam to accompany the unit plan.New Alberta Math Curriculum Resources for Grade 3:AlgebraTimeMeasurementGeometryStatisticsPatterns and
Subjects:
Grades:
2nd - 4th
Types:
Also included in: Alberta Grade 3 Math - BUNDLE - 10 COMPLETE UNITS - FULL YEAR RESOURCE
Histogram Hike - Google Slides and PDF Versions
Want to make histograms fun and keep your student active?Just cut out these 14 histograms/data tables, and post them around the perimeter of your classroom. Place one or two students at each station. Your students will read the question, interpret the data display, and record their answers next to the corresponding number on their papers. And now, your purchase also includes a Google Slides version for Distance Learning! You will need a Google account to access this version.There is also a k
Subjects:
Grades:
5th - 7th
Types:
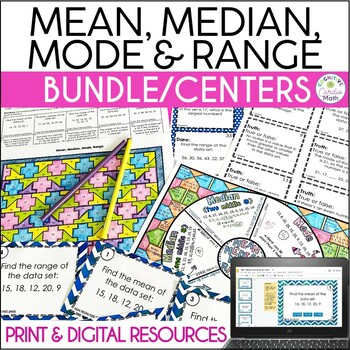
Mean, Median, Mode, Range Activity Bundle Math Centers
Use these mean, median, mode and range resources for your upper elementary or middle school math centers, homework, or independent practice! Some print and some digital.There are both group and independent activities to keep your students active and engaged.The resources include Truth or Dare game, Color by Number, Footloose Task Cards, and Math Wheel for taking notes.In these mean, median, mode, range resources, problems require students to:Find mean, median, mode or range of data setsFind a mi
Subjects:
Grades:
5th - 6th
Types:
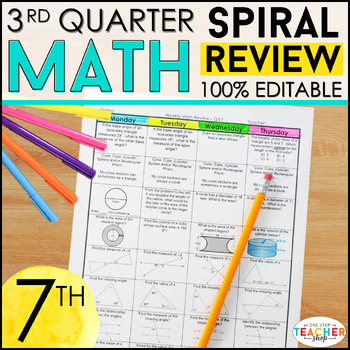
7th Grade Math Spiral Review & Quizzes | Homework or Warm Ups | 3rd QUARTER
This 7th Grade math spiral review resource can easily be used as math HOMEWORK, WARM UPS, or a DAILY MATH REVIEW! This resource was designed to keep math concepts fresh all year and to help you easily track student progress. All pages are 100% EDITABLE and easy to differentiate to fit your students' needs. ★ Get the ENTIRE YEAR BUNDLE! {CLICK HERE} ☝☝ Check out the Preview for more details and 3 FREE Weeks! ☝☝This Spiral Review System is also available for LANGUAGE (Grammar & Word Study)Go 1
Subjects:
Grades:
7th
Types:
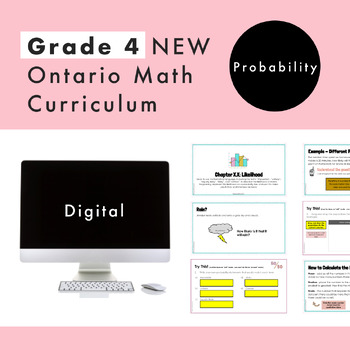
Grade 4 Ontario Math - Probability - Digital Google Slides + Form
Are you planning for the NEW Grade 4 Ontario Math Curriculum? This editable Google Slide and Google Form resource is what you need! This resource is for the DATA strand and and covers specific expectations for “D2. Probability”. In this resource, students will experience math through engaging real-life questions, storytelling through math, and interactive slides. What’s Included2 Google Slide presentations45 UNIQUE and EDITABLE Google Slides in totalSlides are editable for you to increase stud
Subjects:
Grades:
3rd - 5th
Types:
Also included in: Grade 4 NEW Ontario Math Curriculum Full Year Digital Slides Bundle

Bar Graphs Whodunnit Activity - Printable & Digital Game Options
Nothing like a good criminal investigation to liven up bar graphs! Based off my popular CSI projects, I have created Whodunnits? The Whodunnits plan to focus on single content topics as opposed to units and will focus more on skill building than application. Every day can't be a project day, so Whodunnits can be an engaging out of their seat activity to practice important skills. In a Whodunnit?, students will work in teams to solve 10 practice problems that increase in difficult. After each ans
Subjects:
Grades:
3rd - 8th
Types:
CCSS:
Also included in: Pre-Algebra Whodunnit Activity Bundle - Printable & Digital Game Options
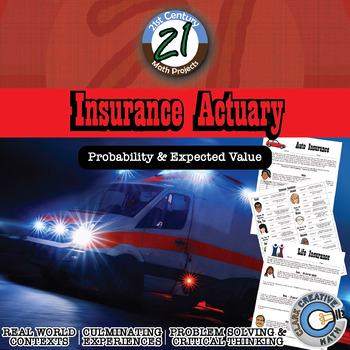
Insurance Actuary -- Expected Value - 21st Century Math Project
Insurance actuaries work hard to analyze risk and make premium recommendations for customers. There is a careful balance between finding an appropriate value based on the risk and creating profit for the insurance company. In this 21st Century Math Project, students where different hats as an actuary to understand insurance!This product includes 4 prep assignments that challenge students in expected value and insurance to build their skills and their thinking for the final project.In this 28 pag
Subjects:
Grades:
8th - 12th
Types:
CCSS:
Also included in: Probability & Expected Value Unit Bundle - Distance Learning Compatible
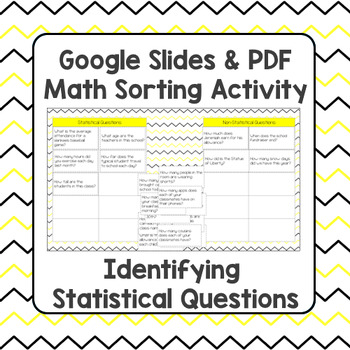
Statistical Question Sort - Digital Google Slides and PDF Versions
Students need to find measures of center and variability, and display data in a variety of ways.This all starts with identifying and asking statistical questions! You will receive 2 versions of this activity: 1 PDF and key, and 1 link to a Google Slides version for Distance Learning! You need a Google account to access the digital version. You can In this sorting activity, students cut out 20 question cards to sort manually, or they drag and drop cards in the digital version to sort in a Goog
Subjects:
Grades:
6th
Types:
CCSS:
Showing 1-24 of 969 results


